The Moneymunch editorial staff is a team of experienced financial writers and analysts with over a decade of experience in the financial markets. They have previously contributed to popular financial blogs and newspapers, and are passionate about providing accurate and up-to-date information to help both investors and traders make informed decisions. Trust the Moneymunch editorial staff to provide reliable and effective financial advice that can help you achieve your financial goals.
Yes, the government prints our businesses paper money. But thats just a little small fraction of the money in use. Most of the funds in state economies is made when banks write it directly into their customers’ accounts as a result of thin air as bank loans.
You earn Rs.10,000 and put it in the bank. And then…The bank keeps RS.1000 in its RBI(Reserve bank of India) account …
This is the “reserve,” which the bank uses when customers withdraw funds. As a rule, depositors don’t take out more than 10% of the money they have on deposit on any given day.
Then loans Susie Rs.9,000, at interest.Susie deposits the Rs.9,000 in her bank.That bank keeps 10% (Rs.900) in reserve and loans Joe Rs.8,100, at interest.
See how it all adds up—for the banks.
You now have Rs,10,000 in your account. Susie has Rs.9,000 in hers. Joe has Rs.8,100.
There’s now Rs.27,100 total in accounts that you and Susie and Joe can spend, and it all came from your Rs.10,000 deposit. The banks have created an additional Rs17,100 by loaning it into existence.
Imagine this money trick over and over.If you do this operation 50 times, that Rs.10,000 turns into Rs.99500.25—Rs.88500.25 in loans, and your original Rs.10,000.Mad math: If those loans are for one year at 10% interest, the banks will make Rs.8800.53. If they’d only been able to loan your Rs.10,000, they’d make Rs.1000.
This is the 17th Day course in a series of 60-Days called “Technical Analysis Training”
You will get daily one series of this Training after 8 o’clock night (Dinner Finished)
Follow MoneyMunch.com Technical Analysis Directory and Learn Basic Education of Technical Analysis on the Indian Stock Market (NSE/BSE)
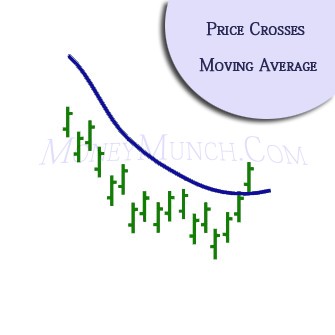
Price Crosses Moving Average
Effect of Price Crosses M.A.
When a security’s price crosses it is moving average (the event), a bullish or bearish alert is produced according to the direction of the crossover.
Story
A moving average is definitely an indicator which performances the average worth of a security’s price over a time period. This kind of Technical Researching happens whenever the price crosses a moving average. Three moving averages are really supported: 21, 50 and additionally 200 days. A price cross of the longer moving average indicates a longer term signal, since the safety might take a longer period of time to move within the anticipated direction.
A bullish alert is produced when the security’s price rises above it is moving average as well as a bearish alert is produced once the security’s price falls below it is moving average.
These events are really based on straight forward moving averages. A simple moving average is one where equal body weight is bearing in mind to any single price around the calculation period. For example, a 21-day simple moving average is calculated if you take the sum of the final 21 days of the stock’s close price and also then separating by 21. Different kinds of moving averages, that are not supported here, are really weighted averages and also exponentially smoothed averages.
Trading Factors
Moving averages are really lagging indicators because the couple utilize historic information. Using them since indicators is not going to get an individual in at the bottom and additionally away during the top however can get an individual in and additionally out someplace between.
They work ideal in trending price designs, where some kind of uptrend or downtrend is strongly put in place.
In trending markets, moving averages can provide a simple and also effective approach to identifying styles.
Moving averages also work as support areas. An individual will often see an extra stock in one uptrend advancement well above its 21 day moving average, return to it and additionally then advancement once again.
Moving averages additionally become resistance areas. When an extra stock investments under a moving average, which average can provide since a resistance price and additionally it is difficult for the extra stock to move above it. This really is frequently really real when an extra stock has fallen below its 200 day moving average.
Factors that Supports
Indicators which are fine appropriate to using moving averages consist of the MACD and also Momentum.
Main Behavior Moving averages do well in trending markets even so they generate numerous false signals in choppy, sideways markets.
Message for you(Trader/Investor): Google has the answers to most all of your questions, after exploring Google if you still have thoughts or questions my Email is open 24/7. Each week you will receive your Course Materials. You can print it and highlight for your Technical Analysis Training.
Wishing you a wonderful learning experience and the continued desire to grow your knowledge. Education is an essential part of living wisely and the Experiences of life, I hope you make it fun.
Learning how to profit in the Stock Market requires time and unfortunately mistakes which are called losses. Why not be profitable while you are learning?
This is the 16th Day course in a series of 60-Days called “Technical Analysis Training”
You will get daily one series of this Training after 8 o’clock night (Dinner Finished)
Follow MoneyMunch.com Technical Analysis Directory and Learn Basic Education of Technical Analysis on the Indian Stock Market (NSE/BSE)
Double Moving Average Crossover
Effect of Two Bar Reversal
When a shorter and longer moving average (of a security’s price) cross one another (the event), a bullish or bearish signal is generated according to the way of the crossover.
Story
A moving average is an indicator which performances the average worth of a security’s price around a period of time. The type of Technical Researching takes place when a shorter and longer moving average cross one another. The supported crossovers are 21 traversing 50 (a short term signal) and 50 traversing 200 (a long term signal).
A bullish signal is produced once the shorter moving average crosses above the longer moving average. A bearish alert is generated whenever shorter moving average crosses below the longer moving average.
These events are really based upon simple moving averages. A straight-forward moving average is one where equal weight is given to any single price around the calculation period. For example, a 21-day straight forward moving average is calculated by taking the sum of the last 21 days of the stock’s close price and then splitting by 21. Different types of moving averages, that are not supported in this case, are weighted averages and also exponentially smoothed averages.
Trading Factors Moving averages are really lagging indicators because they utilize historical information. Utilizing them because indicators cannot get you in during the bottom and additionally away at the top but could get you in and out somewhere amongst. The couple work ideal in trending price layouts, in which a strong uptrend or perhaps downtrend is strongly in place. Getting a crossover moving average because any signal is regarded as superior to the simple and easy moving average because there are two smoothed show of pricing which reduces the sheer number of false signals.
Factors that Supports
Indicators which are well suited to using moving averages include the MACD and also Momentum.
Main Behavior Moving averages excel in trending markets nonetheless they generate numerous fake signals in choppy, sideways markets.
Message for you(Trader/Investor): Google has the answers to most all of your questions, after exploring Google if you still have thoughts or questions my Email is open 24/7. Each week you will receive your Course Materials. You can print it and highlight for your Technical Analysis Training.
Wishing you a wonderful learning experience and the continued desire to grow your knowledge. Education is an essential part of living wisely and the Experiences of life, I hope you make it fun.
Learning how to profit in the Stock Market requires time and unfortunately mistakes which are called losses. Why not be profitable while you are learning?
“Italian new car sales plunged in November…Decline of 20.1% Y/Y.”
– Dow Jones, December 4
“The European debt crisis has given way to a new wave of corruption as some of the most hard-hit countries have tumbled in an annual graft-ranking study.”
– Bloomberg, December 5
This is from a watchdog group called Transparency International. Greece fell to 94th place from 80th, ranking worse than Colombia and Liberia. Greece’s “Golden Age of Democracy” was founded not so much on intellectual inspiration, but more upon Athens sitting on one of the richest silver camps in history. Athenians could afford democracy, Spartans could not. The problem recently is that Greece, like any other country, cannot afford interventionist government.
“German industrial production unexpectedly dropped in October.”
– Bloomberg, December 7
The number was down 2.6% from September, which was down 1.3% from August.
“U.K. Manufacturing production fell more than economists forecast in October. Food and alcohol slumped.”
– Bloomberg, December 7
Progress on this great reformation is being made. The legislature in Michigan passed a “Right to Work” bill. This brings the count to 24 states where people can work without being forced to join a union. They can work without being forced to contribute their money to union leaders with an agenda they may find offensive.
This is the 15th Day course in a series of 60-Days called “Technical Analysis Training”
You will get daily one series of this Training after 8 o’clock night (Dinner Finished)
Follow MoneyMunch.com Technical Analysis Directory and Learn Basic Education of Technical Analysis on the Indian Stock Market (NSE/BSE)
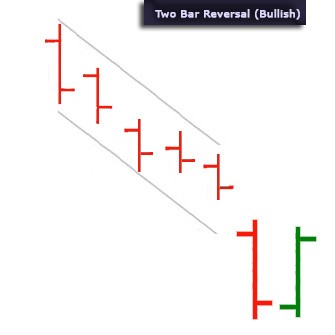
Two Bar Reversal (Bullish) Chart Pattern
Effect of Two Bar Reversal
A Two Bar Reversal (Bullish) indicates a possible reversal of the current downtrend up to a brand new uptrend. This pattern is definitely an sign of a economic instrument’s SHORT-TERM outlook. One and also two-bar patterns mirror changes in investor psychology which have a really short-term impact on future pricing – typically not as much as 10 bars. Often the immediate effect is trend reverse. For traders searching for clear entry and exit aspects, these patterns provide well. These are usually not appropriate since signals for long-term investors unless of course seen since monthly pubs.
Story
A Two Bar Reversal is a classic alert of trend exhaustion. Whenever our patterns happen following a pronounced advance or perhaps decrease, the first bar should display a dramatic continuation of the inbound trend, closing close to the bar’s extreme end. The 2nd bar completely negates the 1st bar, with the open price on the 2nd bar being close to the close of the initial bar plus the close of the 2nd bar being close to the open of the 1st bar. Wider trading ranges upon simultaneously bars denote a more climactic reversal in psychology.
Trading Factors Two Bar Reversals can be either Bullish or perhaps Bearish this depends on the way of the inbound price trend. If the inbound trend is upwards, then upon recognition of the Two Bar Reverse, taking a short positioning or perhaps selling a long position is advised. Conversely, if the inbound price trend is down, then on identification of a Two Bar Reverse, taking a long position or perhaps closing a short position is advised. The degree which the price bars and also volume qualities match the summary will likely feature a bearing on top of the strength of the post pattern price motion. Good trading training dictates that these signals should not be utilized in isolation: fundamental data, area and additionally marketplace evidences and various other technicals for example support/resistance and also momentum tests must be always support the trading decisions.
Factors that Supports
A persistent downward inbound trend is required; the greater and additionally sharper, the more effective.
Simultaneously bars needs incredibly wide trading ranges relative to the past bars created for the duration of the inbound trend.
For each bars, the opening and also closing pricing needs to be since close to the extreme aspects of the bars because possible.
Volume, if in case available, should be high upon simultaneously bars to accentuate the sentiment reversal. The better the growth of volume, the better the alert.
Main Behavior Two Bar Reversals alert the dashing of hopes for anyone traders and investors that was in fact riding the trend or perhaps had jumped upon deck the especially in width trading of the pattern’s 1st bar. The 2nd bar, by in its entirety reversing the ground produced on the first bar, rotates the tide of inbound sentiment and additionally replaces it with one equal and additionally different sentiment see. Search for a outbound trend period that reverses just about any improvements produced within the direct up to the Two Bar Reverse.
Message for you(Trader/Investor): Google has the answers to most all of your questions, after exploring Google if you still have thoughts or questions my Email is open 24/7. Each week you will receive your Course Materials. You can print it and highlight for your Technical Analysis Training.
Wishing you a wonderful learning experience and the continued desire to grow your knowledge. Education is an essential part of living wisely and the Experiences of life, I hope you make it fun.
Learning how to profit in the Stock Market requires time and unfortunately mistakes which are called losses. Why not be profitable while you are learning?
This is the 14th Day course in a series of 60-Days called “Technical Analysis Training”
You will get daily one series of this Training after 8 o’clock night (Dinner Finished)
Follow MoneyMunch.com Technical Analysis Directory and Learn Basic Education of Technical Analysis on the Indian Stock Market (NSE/BSE)
Key Reversal Bar (Bullish) Chart Pattern
Effect of Key Reversal Bar (Bullish)
A Key Reversal Bar (Bullish) indicates a possible reversal of the current downtrend on to a new uptrend. The pattern is an sign of the economic instrument’s SHORT-TERM outlook. One and also two-bar patterns echo changes in investor psychology that have an extremely short-term impact on future prices – typically not as much as ten bars. Often the immediate impact is trend exhaustion, followed by a reversal. For traders searching for evident entry and also exit aspects, these patterns function well. They happen to be normally not appropriate since signals for long-term investors except if viewed because monthly pubs.
Story
A Key Reversal Bar is certainly one which develops following a prolonged rally or perhaps response. Frequently the trend will be accelerating when the price experiences the Key Reversal Bar.
Trading Factors
Key Reversal Bars can be either Bullish or Bearish hinging on the direction of the inbound trend. If in case the inbound price trend is up, then upon recognition of a Key Reversal Bar, taking a short position or selling a long position is recommended. Conversely, if the inbound price trend is down, then upon recognition of a Key Reversal Bar, taking a long position or closing a short positioning is advised.
Problem of the particular pattern is denoted from a price move within the wrong direction beyond the extreme aim of the Key Reversal Bar.
The amount which the price bars and also volume features match the summary probably will have a bearing in the power of the post pattern price motion. Good trading training dictates which these signals cannot be utilized in isolation: fundamental information, area and market evidences and various other technical like support/resistance and additionally momentum studies needs to be utilized to support your trading choices.
Factors that Supports
The price opens firmly within the direction of the prevailing trend.
The trading number is really in width relative to the preceding bars.
The price closes close to or below the preceding close (or almost or above the previous close in a downtrend reversal).
Volume if in case available, must be climactic in the Key Reversal Bar, and also must boost during the course of the inbound trend.
Main Behavior
The presence of a Key Reversal Bar usually signals a reversal of psychology along with a subsequent retracement of latest progress. Having a large opening space upon carried on volume growth, you are seeing the results of climactic sentiment development, however as the bar’s in width trading number consumes upwards a large component, or the overall opening space, you have a extremely powerful indication of sentiment reversal.
Message for you(Trader/Investor): Google has the answers to most all of your questions, after exploring Google if you still have thoughts or questions my Email is open 24/7. Each week you will receive your Course Materials. You can print it and highlight for your Technical Analysis Training.
Wishing you a wonderful learning experience and the continued desire to grow your knowledge. Education is an essential part of living wisely and the Experiences of life, I hope you make it fun.
Learning how to profit in the Stock Market requires time and unfortunately mistakes which are called losses. Why not be profitable while you are learning?


 Mad math: If those loans are for one year at 10% interest, the banks will make Rs.8800.53. If they’d only been able to loan your Rs.10,000, they’d make Rs.1000.