To become a subscriber, subscribe to our free newsletter services. Our service is free for all.
Continue reading


To become a subscriber, subscribe to our free newsletter services. Our service is free for all.
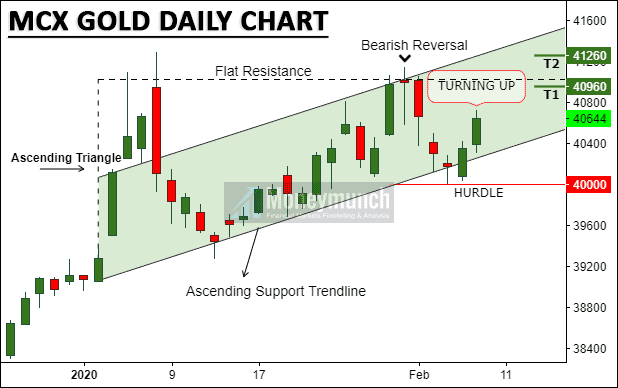
If gold breakdown a flat resistance line, it will fly in the sky. Gold will pressurize by speculators up to 41400 – 41600 – 42000 levels.
Remember, it could happen by a complete breakout of a flat resistance line only.
Hurdle or ascending support trendline breakout indicates to stop buying. It will fall the prices up to 39560 – 39260 level.
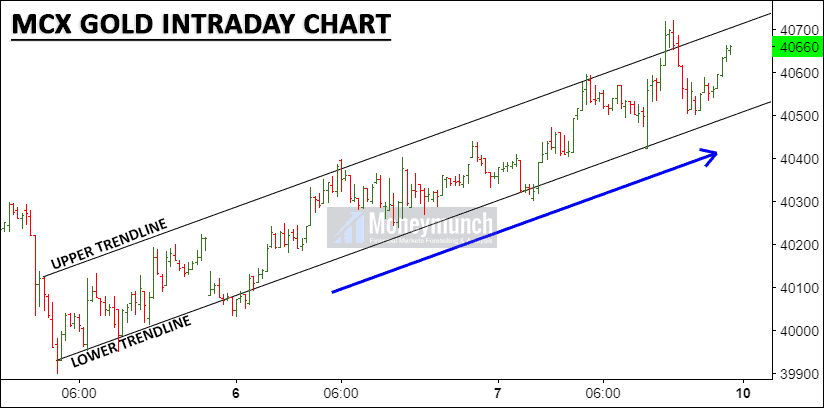
For trend identification, check this 15 minutes intraday chart of gold. Keep eyes on a lower trendline before initiating a position. Further information will update soon for the subscribers only. To become a subscriber, subscribe to our free newsletter services. Our service is free for all.
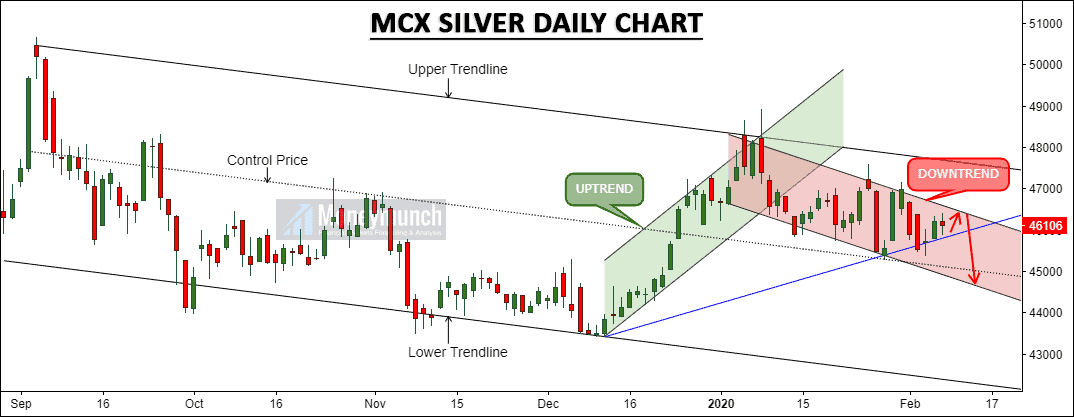
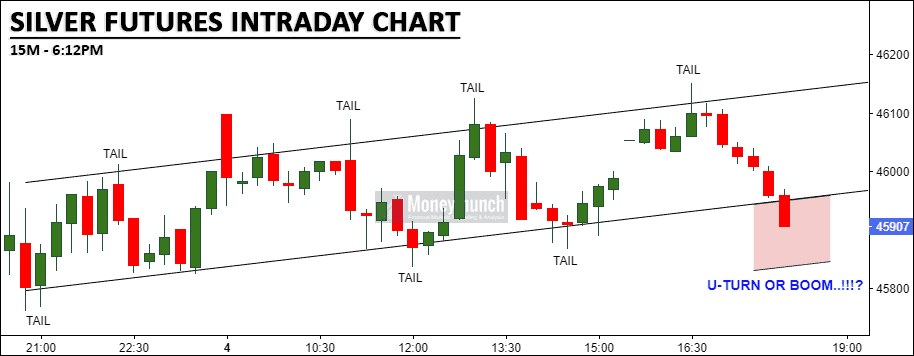
Gold can influence the silver price upside up to the upper trendline. As per the technical analysis, currently, it’s under downtrend. As described in the above chart, It may keep falling for 45600 – 45000 levels.
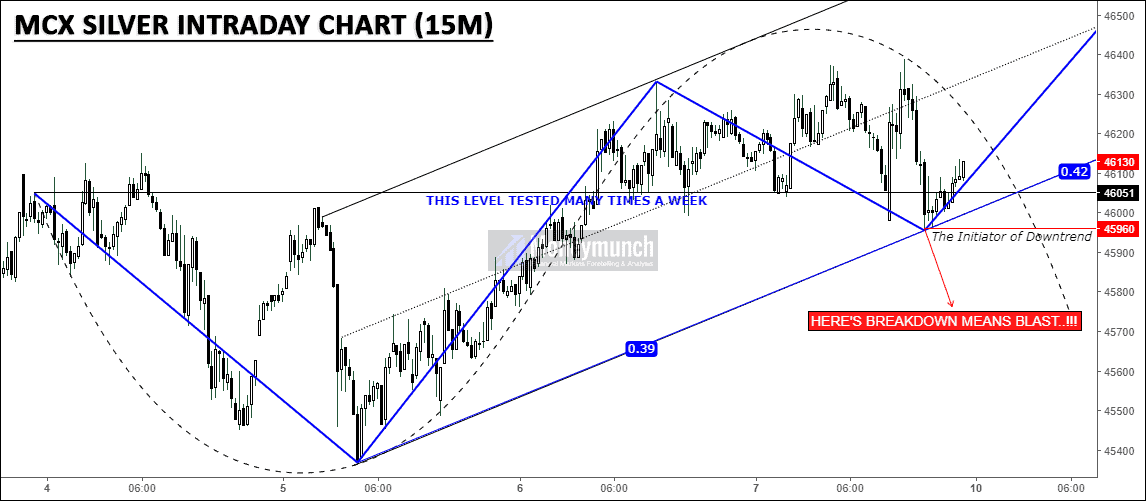
Look at the many times tested level, this can drag the silver price up to 46400 – 46600+.
To become a subscriber, subscribe to our free newsletter services. Our service is free for all.
To become a subscriber, subscribe to our free newsletter services. Our service is free for all.
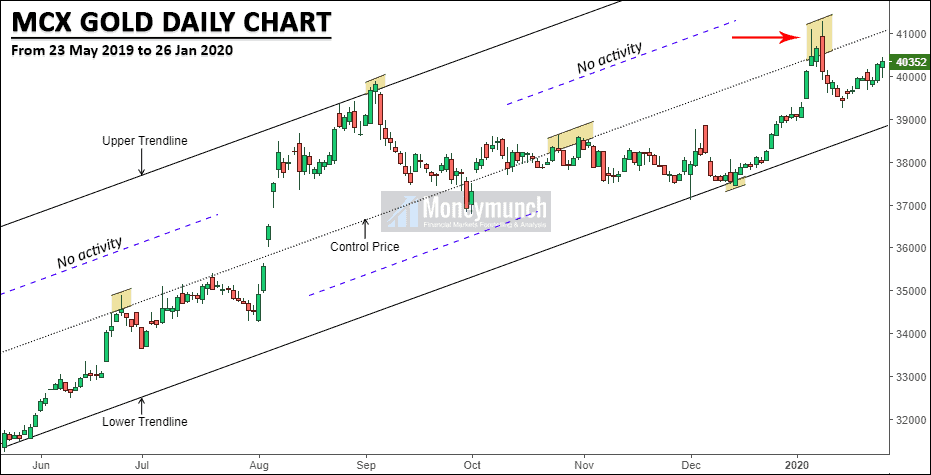
As per the daily chart, gold prices continue moving higher. After a reversal, we can expect the following levels ahead: 40800 – 41000 – 41360+
Why reversal? Look at the below 15-minutes chart of gold:
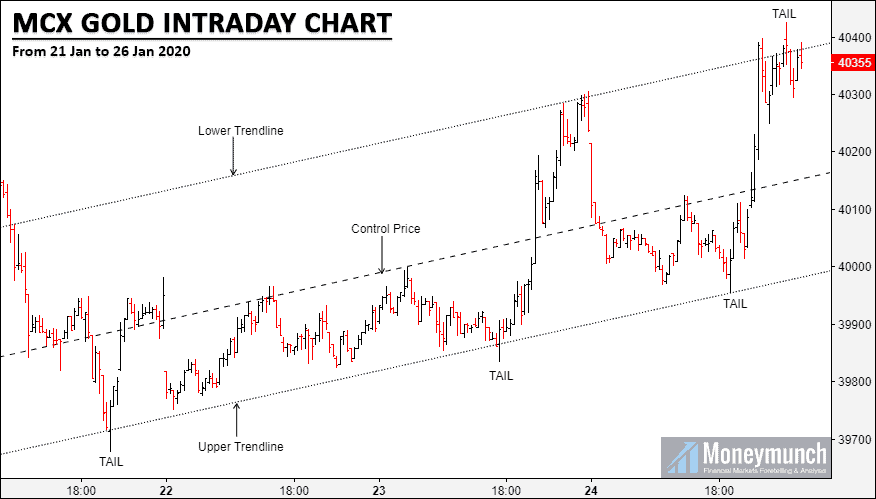
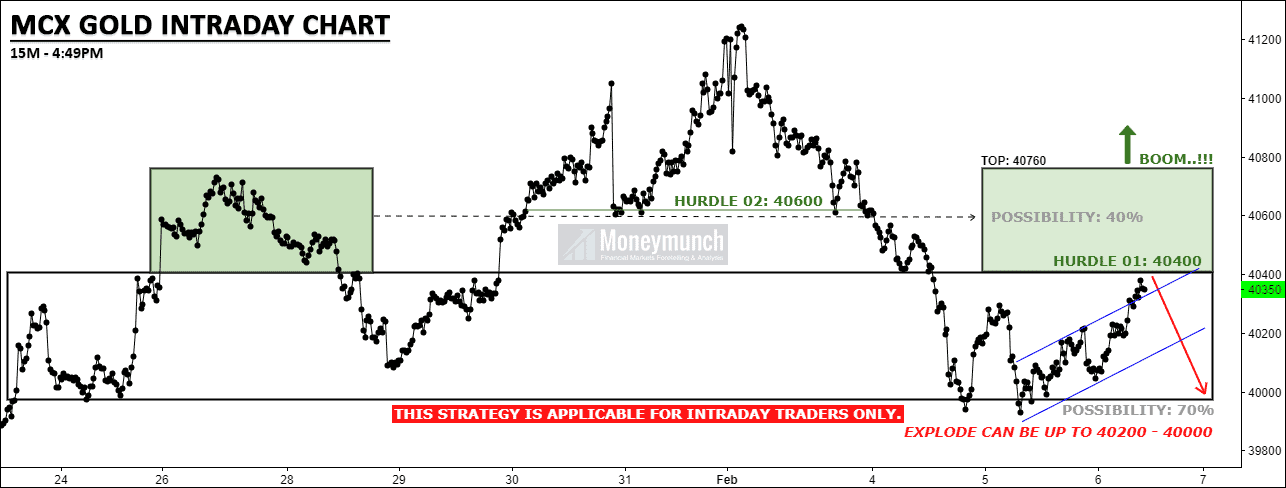
As per this chart, gold can easily fall for 40160 – 40000 levels. It’s the same technical chart I had updated in the previous newsletter. And it has also touched all intraday targets.
Read it here, Next Move of MCX Gold.
As per the intraday chart, day traders should keep buying the gold for 40600 – 40800 until it breaks the upper trendline. And the breakout of the upper trendline will explode prices. It could be up to 39760 – 39500 below levels.
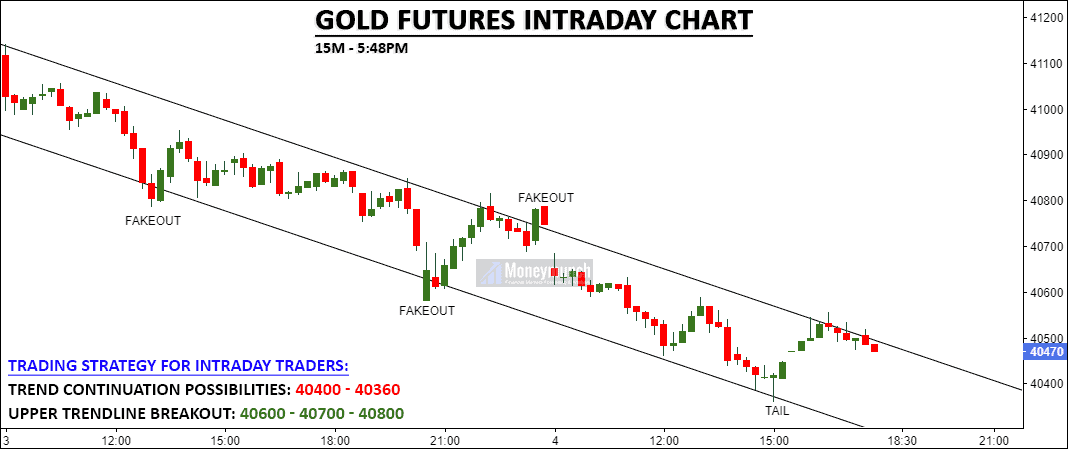
Similarly, my view is the same for the gold futures (CFD). Look out the below chart, it will explain to you better.
To become a subscriber, subscribe to our free newsletter services. Our service is free for all.
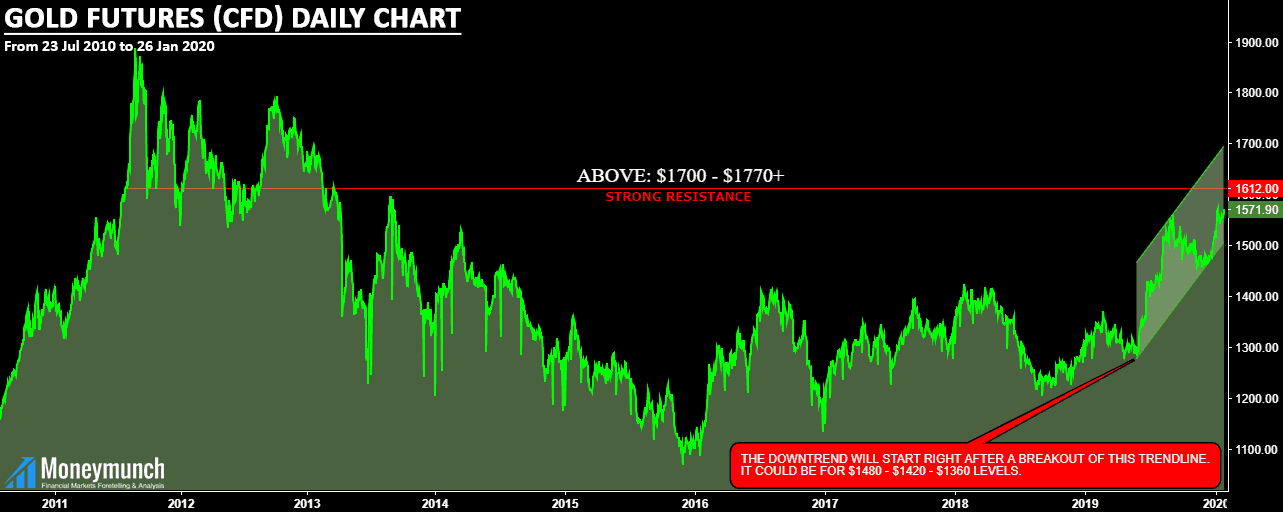
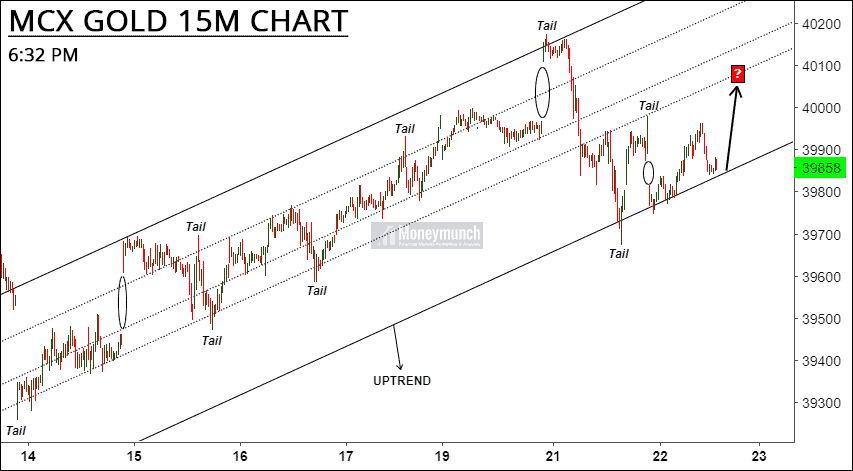
As per the chart, the uptrend trendline breakout means gold will explode. That can up fall up to 39760 – 39632 – 39500.
It happens in complete breakout only. With the uptrend line, following levels are awaiting ahead: 39960 – 40040.
To become a subscriber, subscribe to our free newsletter services. Our service is free for all.
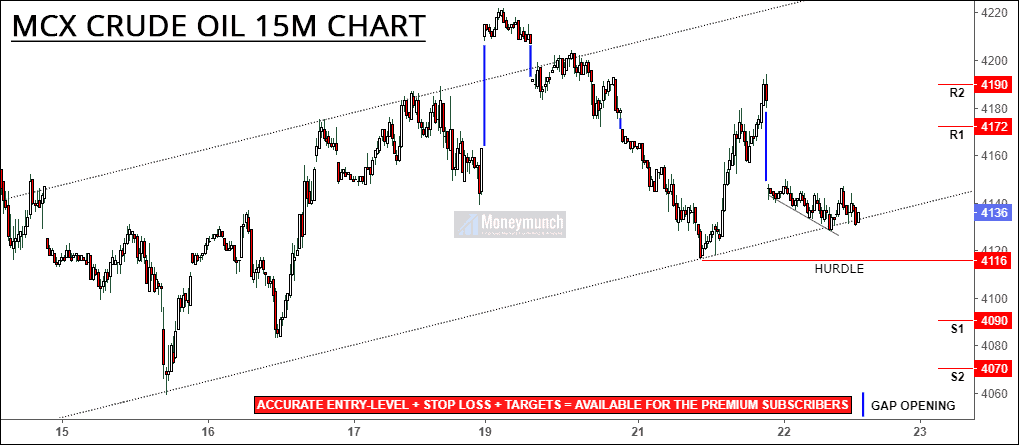
Hurdle: 148
Level 132 is the next confirmation level to continue the downtrend. It could be up to 128 – 120 – 112.
 Unlock This Article