Why Nike Stock Has Been Under Pressure
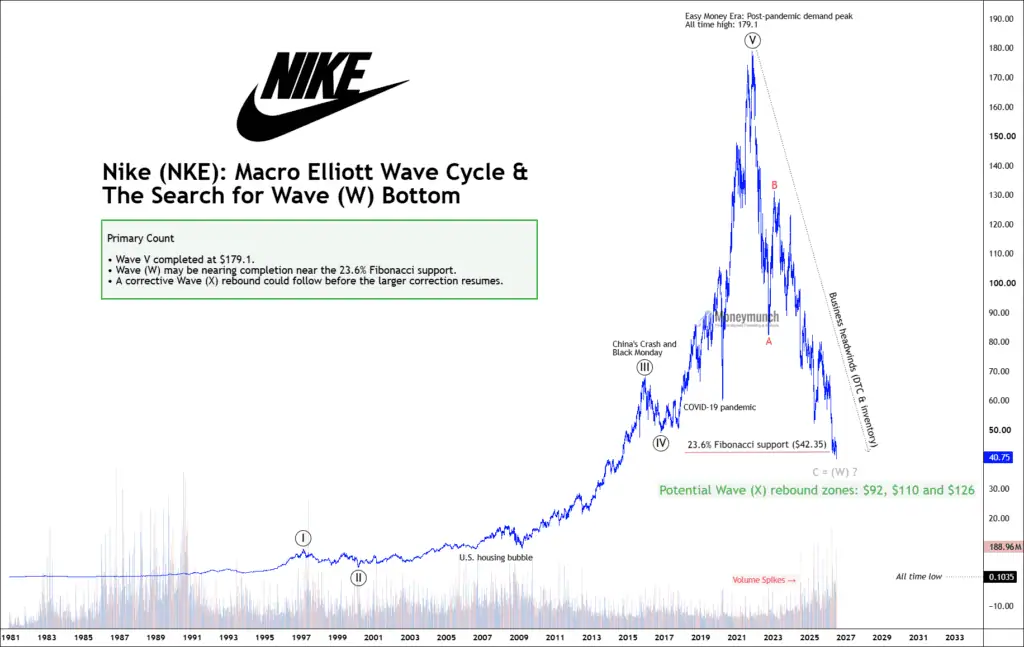
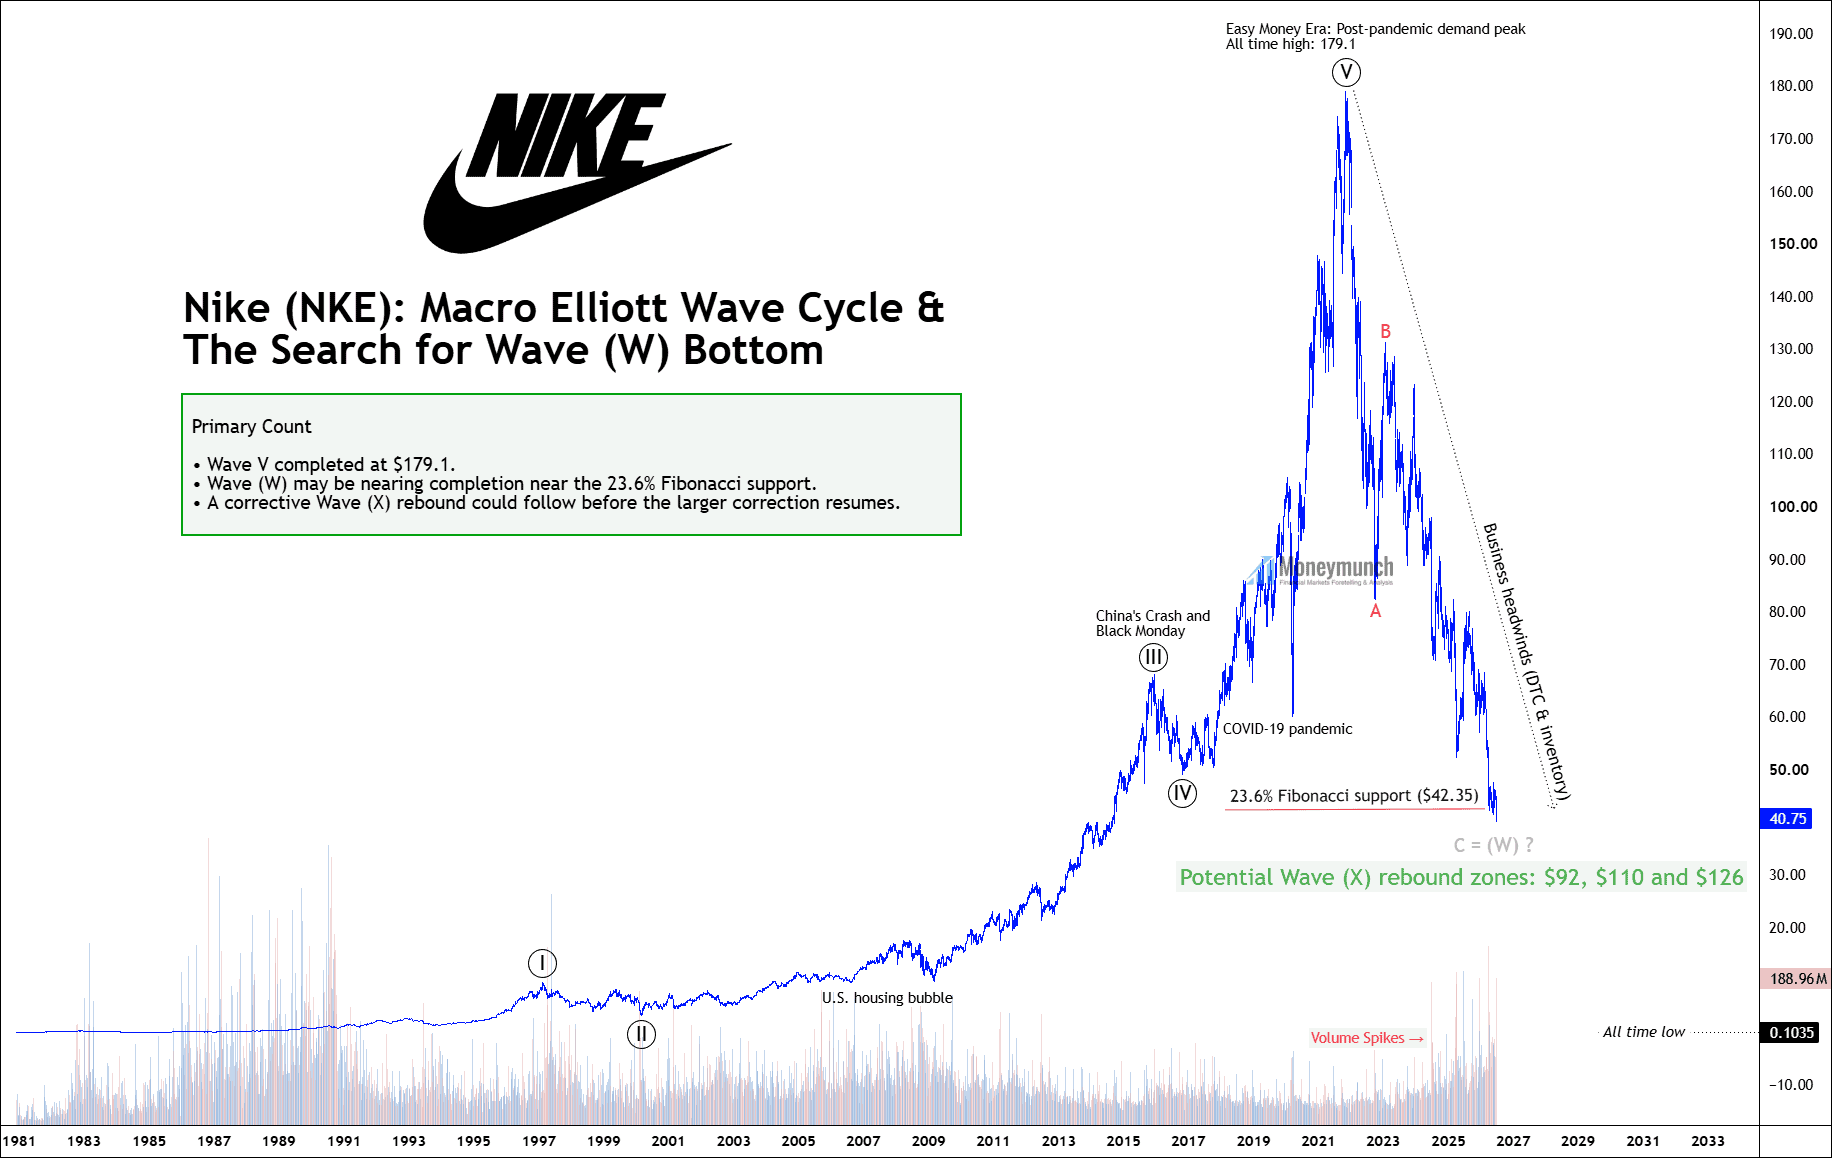
Nike has experienced one of the strongest long-term bull markets in history, rising from just a few cents in the early 1980s to an all-time high of $179.10 during the post-pandemic “Easy Money Era.” The weekly chart shows a complete five-wave Elliott Wave advance, suggesting that the long-term impulsive cycle may have ended at the 2021 peak. Since then, the stock has been moving through a broad corrective phase, reflecting both weakening investor sentiment and a change in the company’s business environment.
The long-term advance was supported by several major economic events. Wave I developed during the company’s early growth years, followed by Wave II during the technology bubble period. Wave III accelerated after the global financial crisis as Nike expanded its global presence and benefited from strong consumer spending. Despite temporary setbacks such as China’s market crash in 2015 and the COVID-19 pandemic in 2020, buyers quickly returned, driving the stock into Wave V. Extraordinary monetary stimulus, strong consumer demand, and record earnings helped push Nike to its all-time high near $179.10.
Since reaching that peak, the technical picture has changed significantly. The stock has been making a series of lower highs and lower lows, which is consistent with a long-term corrective trend rather than the continuation of the previous bull market. The current decline is labeled as an A-B-C correction, where Wave A and Wave B appear complete, while Wave C is approaching an important support area. If this interpretation is correct, the completion of Wave C would also complete a larger Wave (W) in the higher-degree correction.
One of the most important technical levels on the chart is the 23.6% Fibonacci retracement, located near $42.35. Long-term investors often watch major Fibonacci retracement levels because they frequently act as areas where selling pressure begins to weaken and buyers gradually return. Nike is now testing this support after several years of persistent decline, making this price zone particularly important from both a technical and psychological perspective.
The decline has also coincided with several business challenges. Slower consumer demand, inventory management issues, and changes to Nike’s Direct-to-Consumer (DTC) strategy have weighed on investor confidence. These fundamental concerns have reinforced the bearish price structure visible on the chart and explain why the stock has struggled to recover despite its strong long-term brand value.
Although the current trend remains bearish, the Elliott Wave structure suggests that the downside may be entering its later stages. The chart identifies the current area as “C = (W)?“, indicating that confirmation is still required before declaring the correction complete. A sustained move above nearby resistance, combined with improving price structure and stronger buying volume, would increase confidence that Wave (W) has ended and that a new corrective Wave (X) rebound has begun.
If Wave (W) is confirmed near the current support zone, the next expected move would be a counter-trend rally in Wave (X). Based on historical resistance levels and Fibonacci relationships, potential rebound targets are located near $92, $110, and $126. These levels represent possible resistance zones where a corrective recovery could slow or reverse. It is important to remember that Wave (X) would likely be a corrective rally rather than the start of a new long-term bull market.
From a risk management perspective, investors should continue monitoring price behaviour around the 23.6% Fibonacci support. A successful hold above this level, accompanied by improving momentum and higher trading volume, would strengthen the bullish recovery scenario. However, if the stock breaks decisively below this support and fails to recover, the correction could extend further before a durable bottom is established.
Get free forex & currency ideas, chart setups, and analysis for the upcoming session: Forex Signals →
Want to get premium trading alerts on GBPUSD, EURUSD, USDINR, XAUUSD, etc., and unlimited access to Moneymunch? Join today and start potentially multiplying your net worth: Premium Forex Signals
Premium features: daily updates, full access to the Moneymunch #1 Rank List, Research Reports, Premium screens, and much more. You΄ll quickly identify which commodities to buy, which to sell, and target today΄s hottest industries.
Have you any questions/feedback about this article? Please leave your queries in the comment box for answers.