
Timeframe: 1h
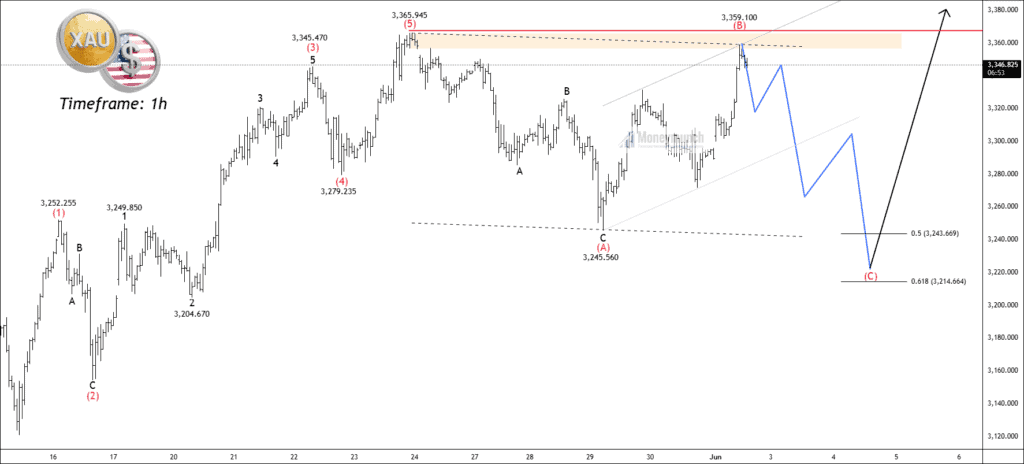
Gold (XAUUSD) recently completed a strong five-wave rally on the one-hour chart, reaching a peak near the 3,365 level. This upward move fits well within the classic Elliott Wave framework, showing clean subdivisions and momentum typical of a bullish impulse. After this peak, the price began to stall and show signs of exhaustion, indicating that a corrective phase was likely underway following the completion of the fifth wave.
The market has since started forming what appears to be an ABC correction. The initial drop to around 3,245 marks Wave A, followed by a recovery into the 3,359 area, which likely completes Wave B. This second wave coincided with a known resistance zone and triggered a sharp rejection, suggesting a possible bull trap or liquidity sweep. Based on this structure, the final leg of the correction, Wave C, is expected to bring prices down toward the 3,243 to 3,214 range. This zone aligns with both the 50 percent and 61.8 percent Fibonacci retracement levels, making it a critical area to watch for a potential reversal. Once Wave (C) of Wave 2 is complete, traders can anticipate the beginning of an upward move as Wave 3 unfolds.
We will update further information soon.
 Unlock This Article
Totally agree with your count!
Let’s see 🙌🏽🙌🏽
The End is Near – Wave c
Interesting take!