 Unlock This Article
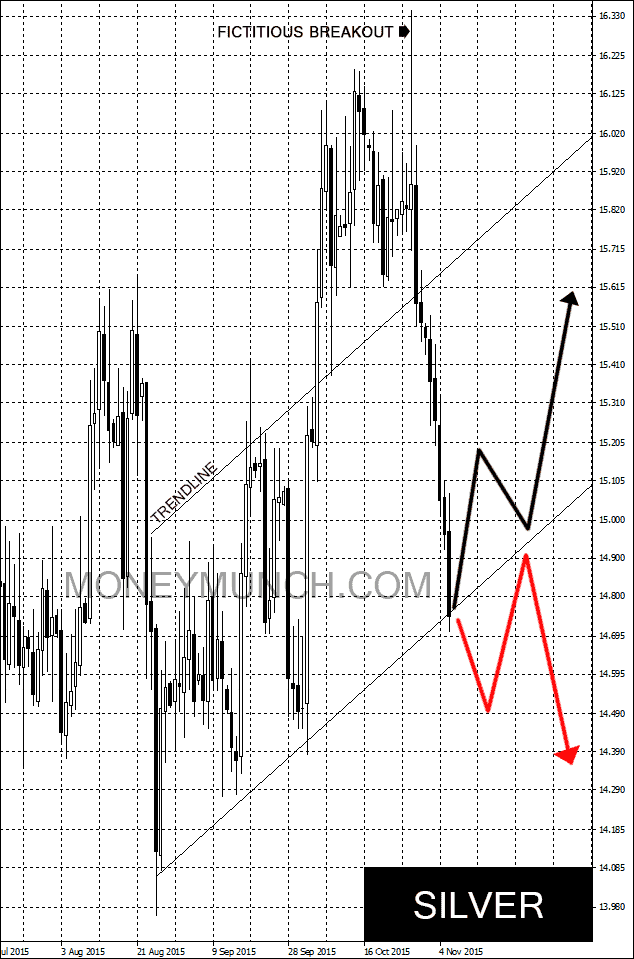
Once silver will stay 1-2 consecutive hours below to 34360 then it may show 34250-34160-34K levels. And if silver will take rest above, 34400 levels then we see non-stop upward moves. It can break 34700-34800 levels!
To become a subscriber, subscribe to our free newsletter services. Our service is free for all.

Today, crude oil will try to go upside. If it breaks and stay above 38.26 levels for 1 hr, then the crude oil small uptrend will being, and it will hit 38.9-39.8 levels.
And if crude oil will break and stay below the 37 level then we’ll see extremely downtrend, and it breaks 36.6-36 below levels.
More information I’ll provide to commodity / forex premium subscribers.

A small downtrend has been begun in lead metal. Today, lead will hit 113-112.6 levels!
But the lead solid support are 112.3 level and hurdle is 111.9 level, so be careful before investing.
Take someone expert advices because my targets and levels are intact, but perfect entry levels require before make trades. It’s a sure shot!
Continue reading