EWT: NSE United Spirits Multiple Time Frame Studies

Time frame: Weekly
Free nse unitedspirit chart calls

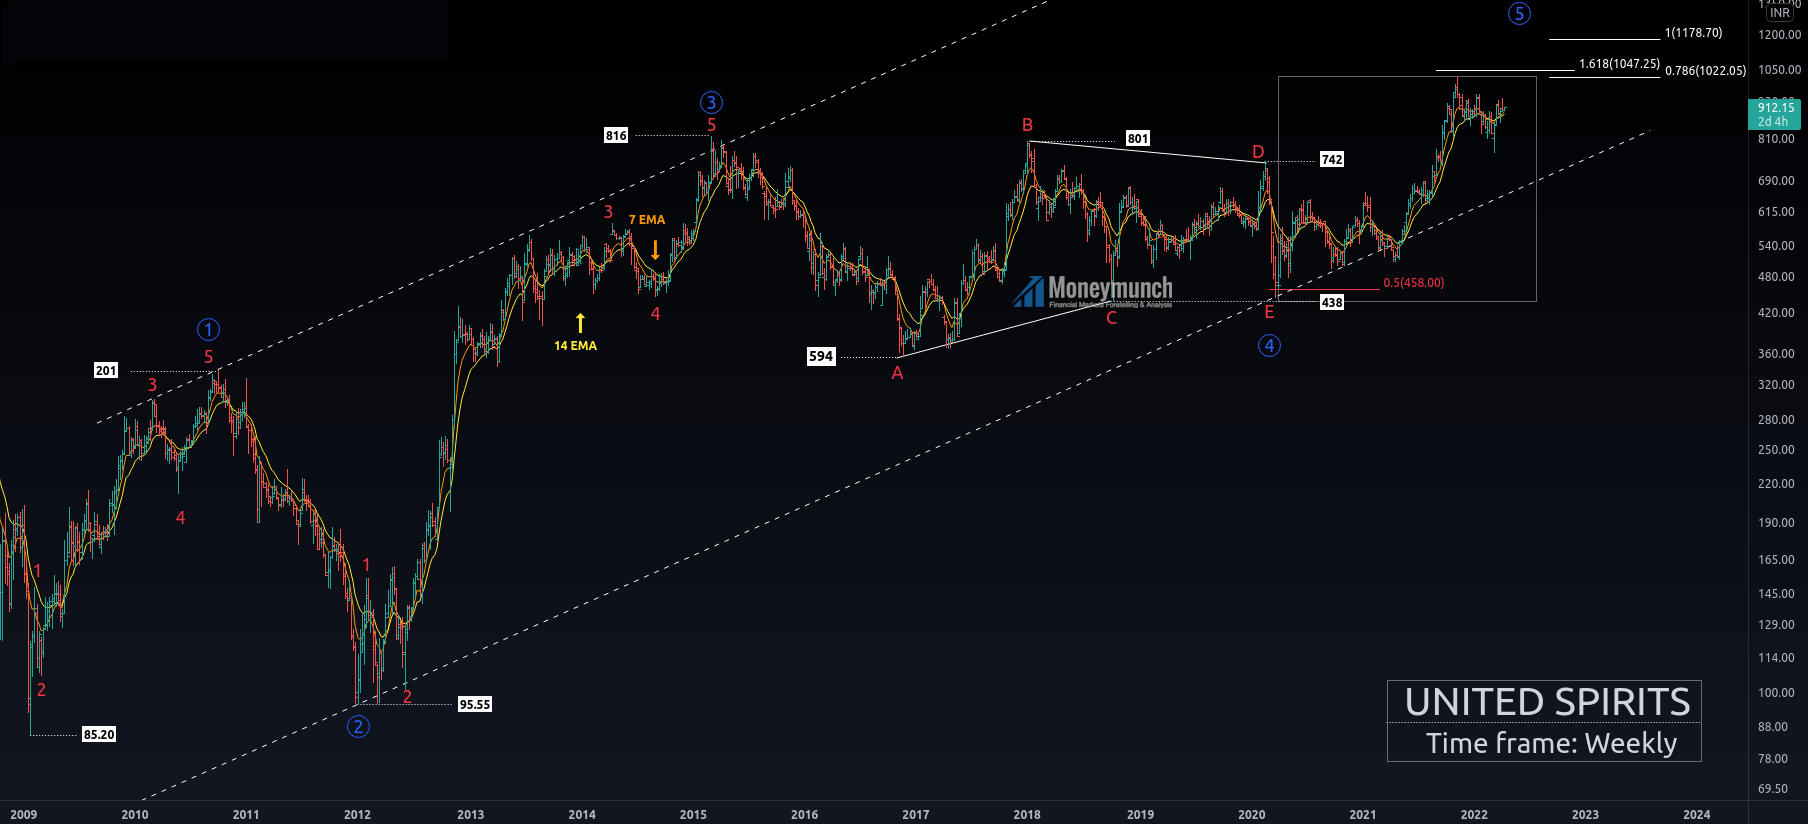
United Spirits has started wave cycle from 85.20.
Wave ((1)):
Wave ((1)) is an impulse pattern that occurred in 201.

Wave ((2)):
Wave ((2)) is a zigzag pattern that occurred at 95.55.
Wave ((2)) retraced 100% of wave ((1)).
Rule 1: Wave ((2)) can never overlap the starting point of wave ((1)).

Wave ((3)):
Wave ((3)) is an impulse with extensive nature, 3.618% of wave ((1)) occurred at 816.
Rule 2: Wave ((3)) can never be the shortest impulse wave.

Wave ((4)):
Wave ((4)) is a triangle pattern with a five-wave structure, retraced 50% of the wave ((3)).
A: 594
B: 801
C: 438
D: 742
E: 442 (terminating wave)
Price surged after the breakout of the B_D trend line.
Rule 3: wave 4 can never enter the price territory of wave 1.

Wave ((5)):
Currently, price is forming an impulsive wave ((5)).
Wave ((5)) has retraced 161.8% reverse Fibonacci of wave ((4)), which is the most acceptable retracement for wave ((5)).

Wave ((4)) extended 78.6% of wave ((1)) through ((3)) at 1020, and the price had made a high of 1019. It is also an ideal level for wave ((5)).

We still have a 100% Fibonacci extension level for wave ((5)). Our next step is to analyze the lower time frame chart and study the sub-wave behavior of waves ((5)).

Time frame: Daily
Fee nse stock unitedspirit chart daily calls

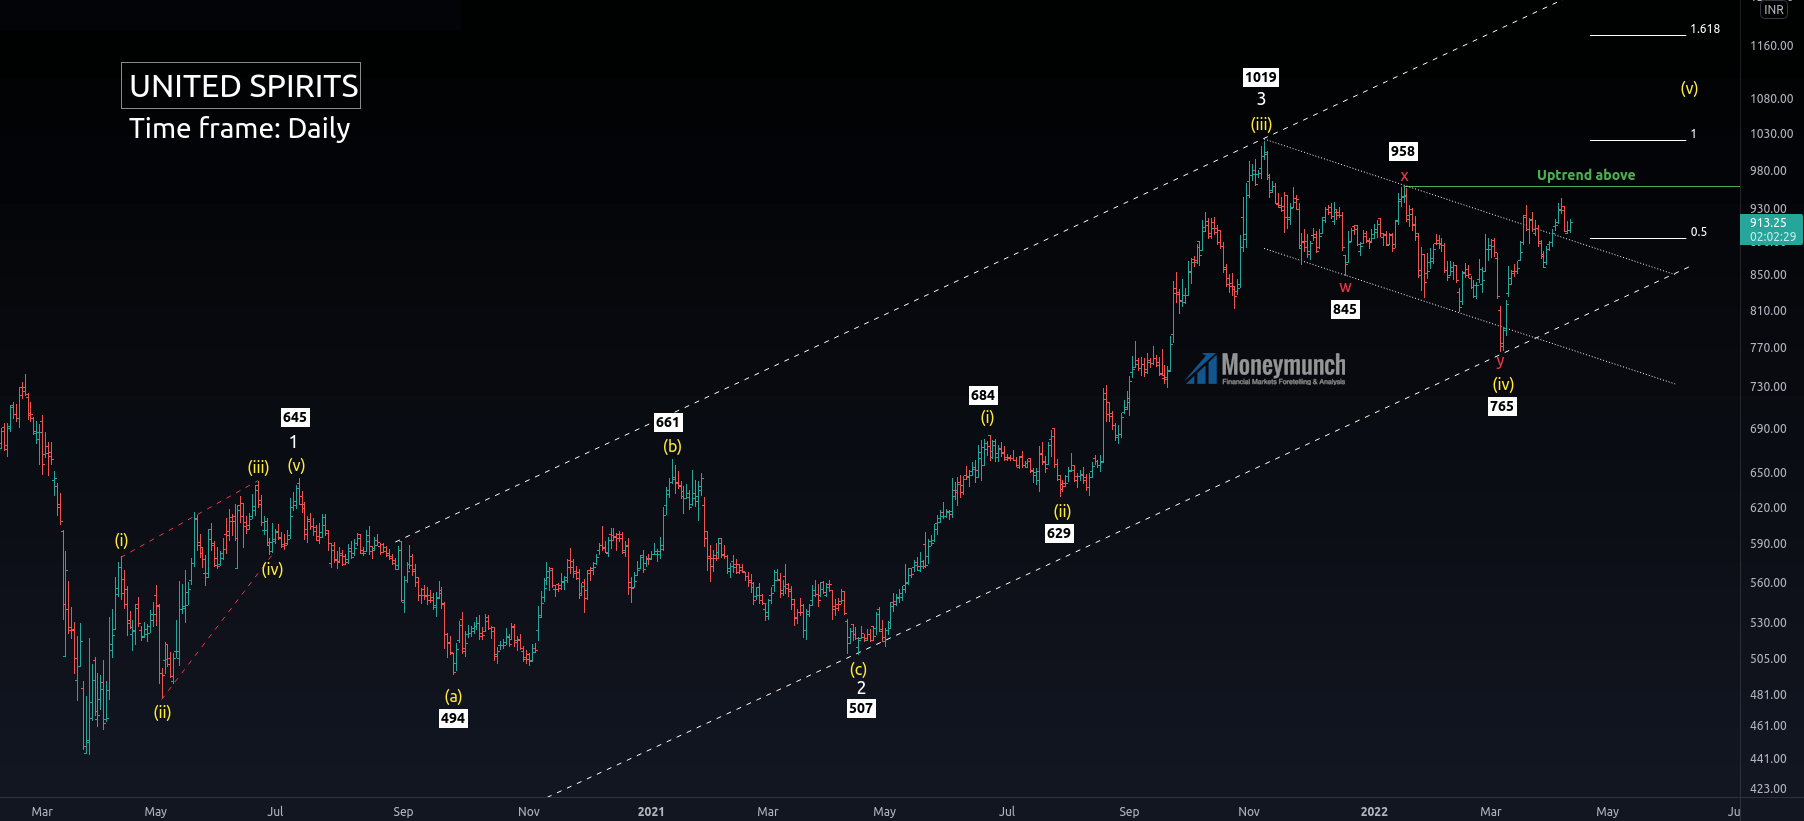
Sub-wave cycle of wave ((5)) starts from 442.65. Price accomplished a corrective wave ((iv)), and price surged rapidly.
Wave ((iv)) is a double zigzag that contains seven waves.

If the price fails to break wave (x), Traders can sell for the following targets: 989 – 864 – 811. (U-turn levels).

Wave X holds most of the power of the impulse. If the price is capable to sustains above wave X, traders can expect the following targets: 974 – 1020- 1178+. Traders can enter at the 50% level of the current price move.
Note: trend never establishes without confirmation from wave (X).
To become a subscriber, subscribe to our free newsletter services. Our service is free for all.

Continue reading

NSE Sail Stock Price Can Hike Rs.50+ From Here

Free nse stock sail chart calls

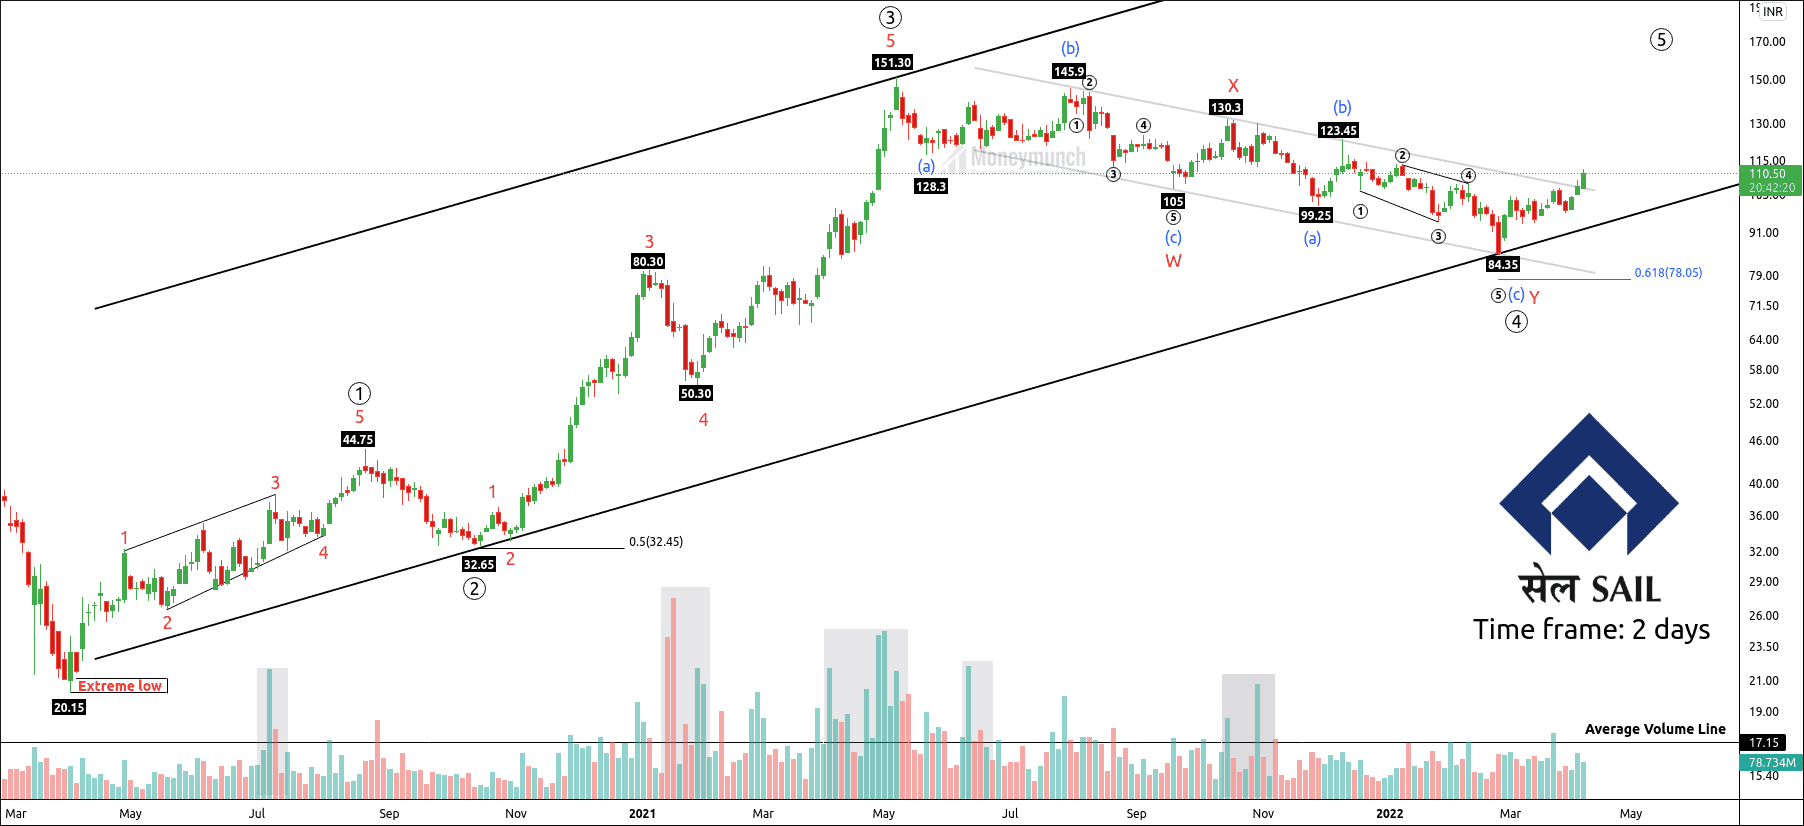
SAIL has been forming descending channels for more than 47 weeks. It has accomplished corrective structure((4)) at 61.8% of wave ((3)).

Wave ((4)) is a double combination pattern. After creating a low of 84.35, the price started marching upward.

If the price breaks out of the corrective channel, traders can trade for the following levels: 123 – 143 – 162+.  But bears can take control if there is a fake-out.

To become a subscriber, subscribe to our free newsletter services. Our service is free for all.

Continue reading

NSE Adani Ports Is Growing Near Truncation Zone

Free nse stock adaniport chart calls

Key Level: 824 & 853
Adani Port has broken down the corrective wave X and started forming an impulse wave ((5)).

Price had broken down the 8-month-old correction, and Adani Port surged rapidly. Adani Port can U-turn from 1.618% at 1049. It is a reverse Fibonacci of wave ((4)). Currently, the price is at the 78.6% reverse Fibonacci level at 853.

If Adani port fails to break the previous high at 901, there will be a case of truncation. It shows that the current impulsive move has a lack of demand pressure. Then the decline will be 3x more powerful than the normal corrective wave.

To become a subscriber, subscribe to our free newsletter services. Our service is free for all.

Continue reading

NSE Apollo Hospital Trading Call – Bearish?

Free nse stock apollohospitals chart calls

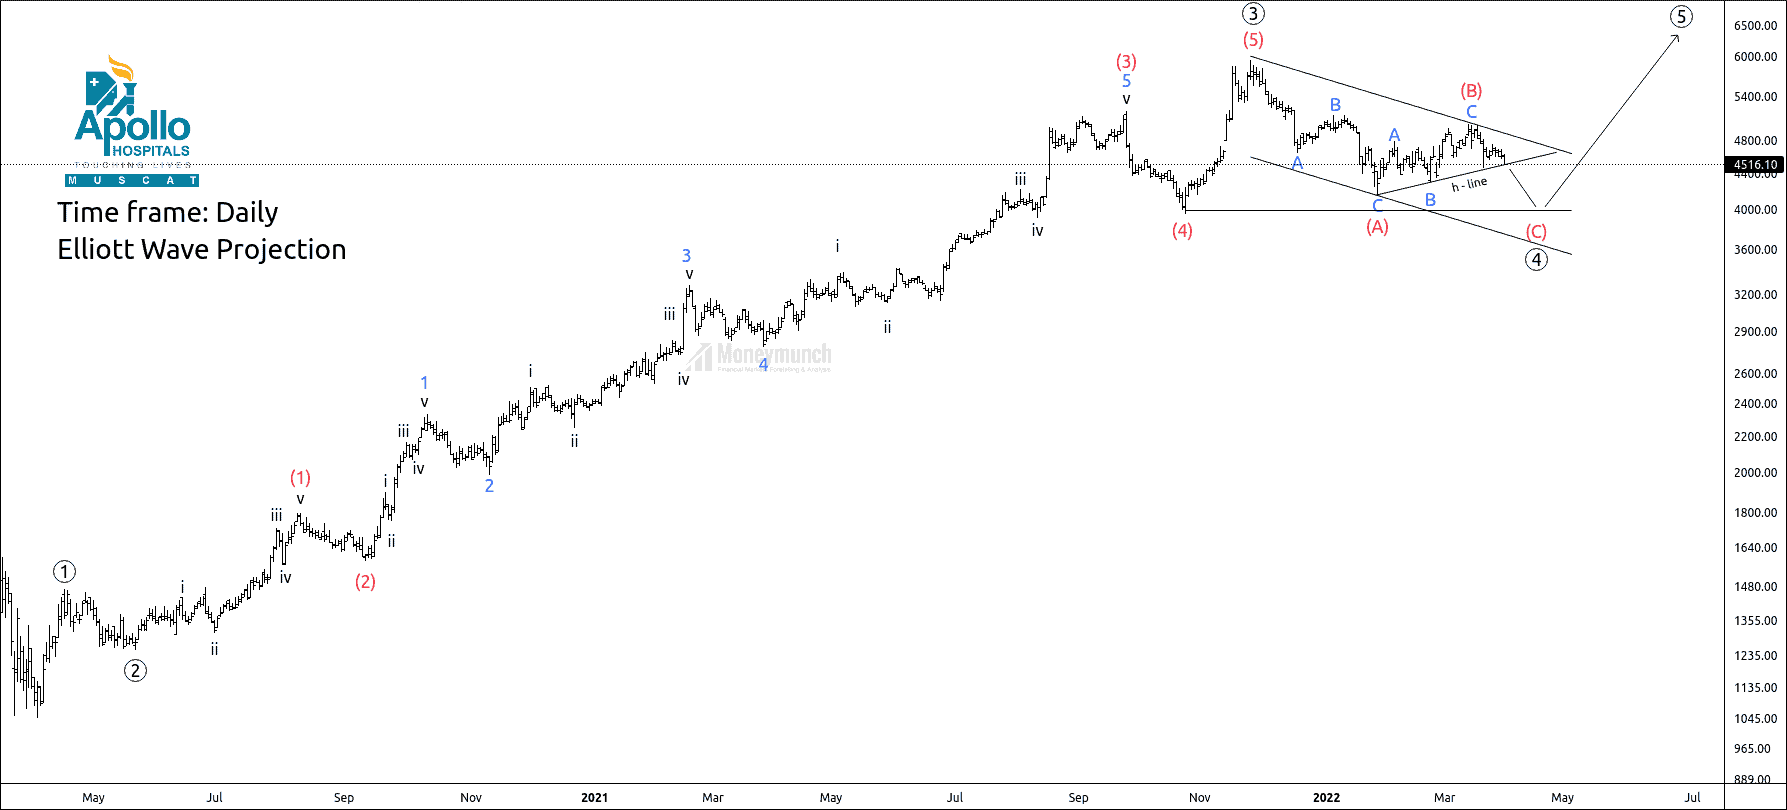
Apollo hospital is preparing for the last corrective move

Key Level: 4475 and 5013

Apollo hospital had completed Impulsive wave ((3)) at 5935 and started corrective wave ((4)).

If the price breaks the H-line, traders can sell for the following target: 4437 – 4356 – 4239 below. These are the price levels where the price can u-turn for an impulsive wave ((5)).

A corrective wave is the construction of a three-wave and evidence of an impending impulsive wave.

Traders can also initiate a long setup only in price breaks the impulsive channel. I will upload a long trade setup after the accomplishment of wave ((4)).

To become a subscriber, subscribe to our free newsletter services. Our service is free for all.

Continue reading

NSE Calls – Pokrana Trade Setup

Do you remember Pokrana’s Elliott wave analysis?
[24 March 2022] NSE Pokrana Reloads For Another Price Rally

Free nse stock pokarna chart callsBEFORE:

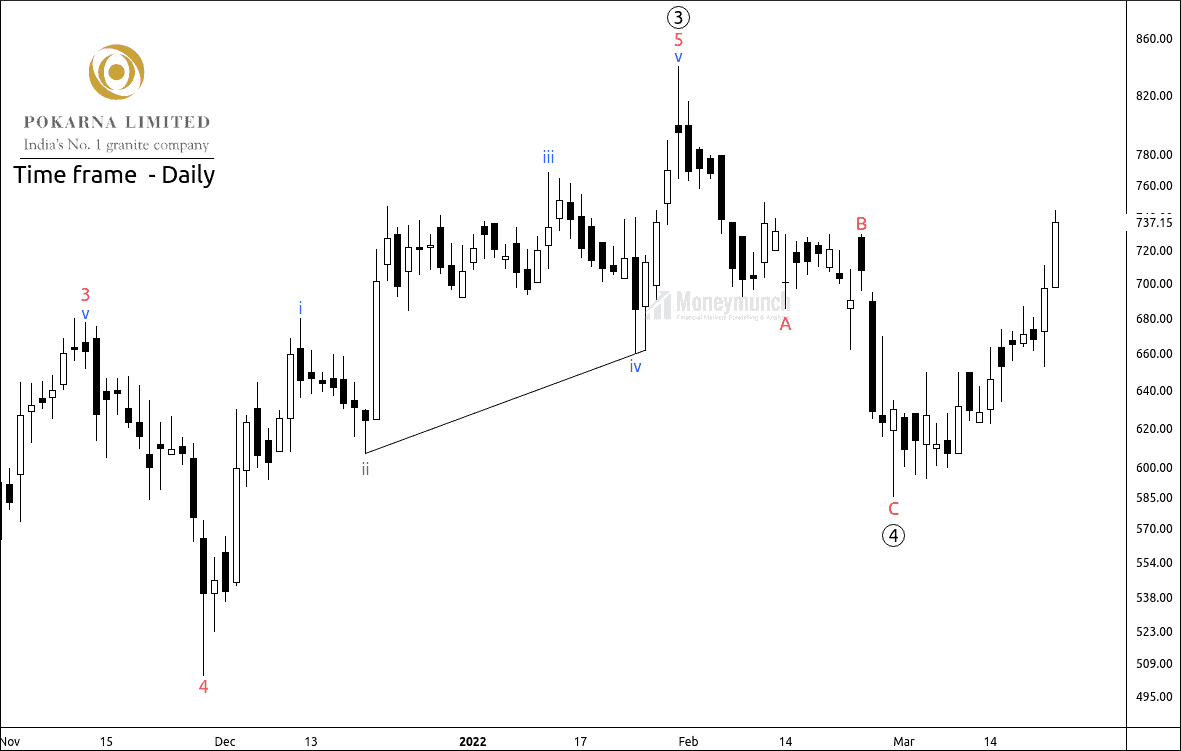
Pokrana had completed the corrective wave ((4)) and started forming impulsive structures. Price was at wave B of the previous wave.

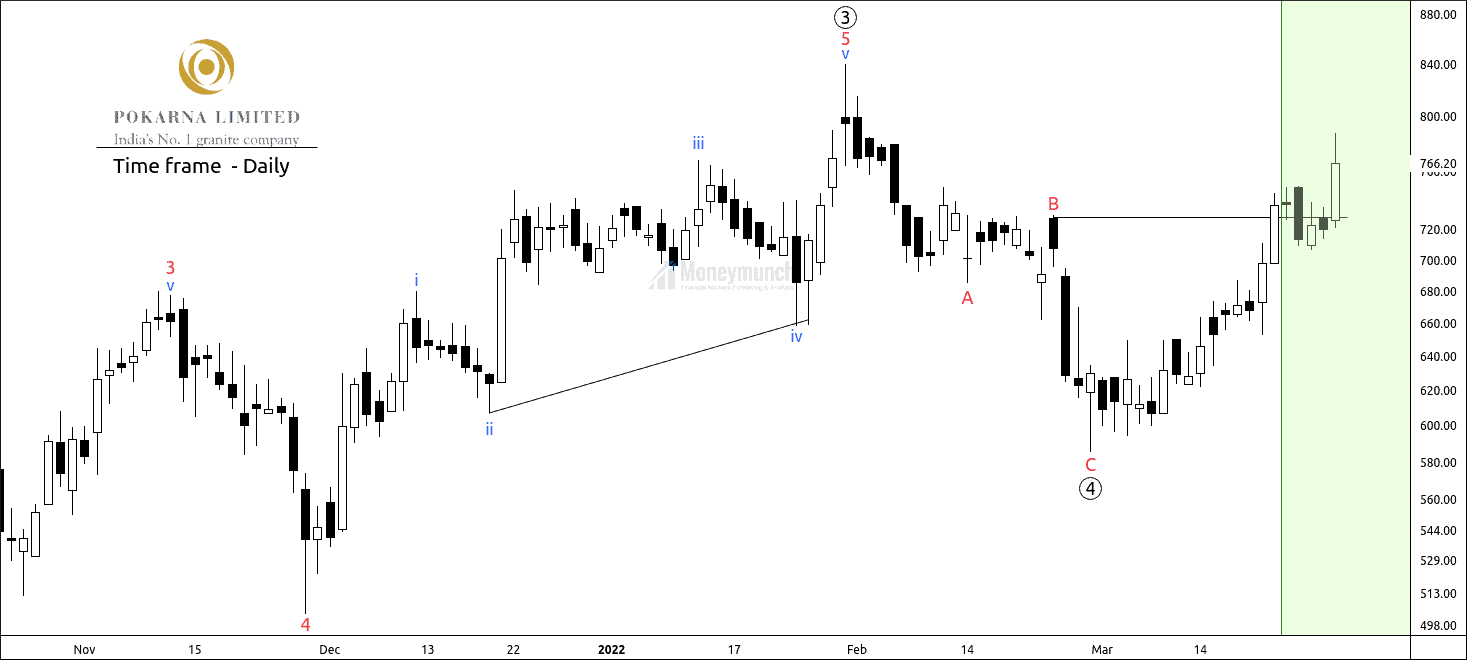
I had mentioned in clear words, “If the price breaks the corrective wave B, traders can expect the following levels for impending impulse thrust: 752 – 770 – 800+

AFTER:

TODAY
12:30 PM – Pokrana reached the first target of 752.
12:45 PM – Pokrana touched the second target of 770.

Will Pokrana hit the final target of 800?

To become a subscriber, subscribe to our free newsletter services. Our service is free for all.

Continue reading

NSE Nifty Has Completed The Correction Phase But…

Did you read Nifty’s research report?
[Yesterday] NSE NIFTY Rebound Change Of Trend Or Just A Correction?

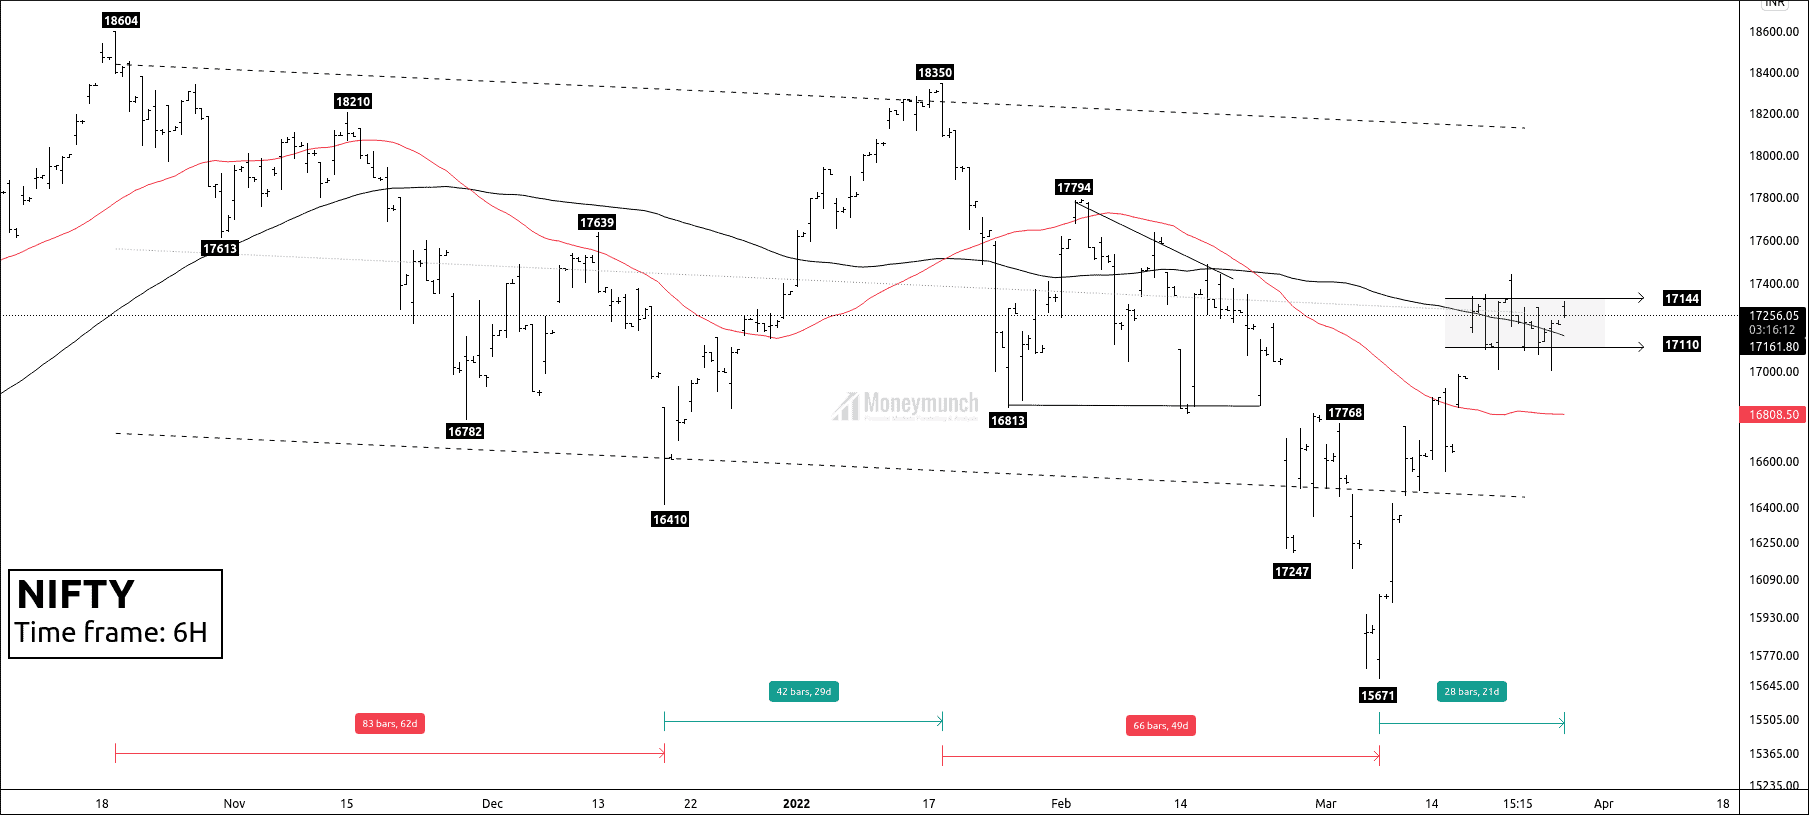
Free nse nifty chart callsBEFORE

Nifty has formed the value area where supply and demand were a deadlock. Destruction of the equilibrium zone is evidence of a big move.

Price was also on the control line of the parallel channel, and the Price crossed 50 MA.

I have mentioned in bold words, “If the Nifty breaches the upper band, we can expect 17365 – 17562 – 17600.”

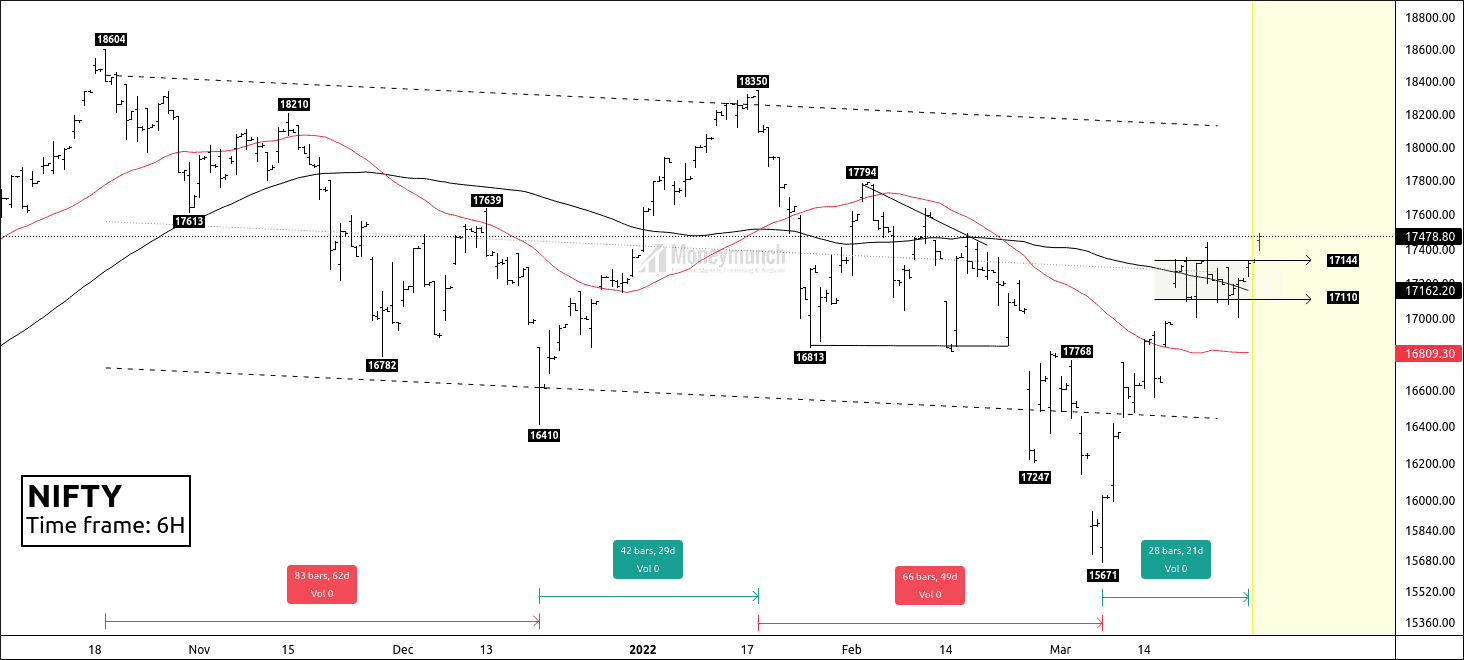
Free nse index nifty chart calls AFTER

[Today]

  • 09:15 AM: Nifty touched the first target of 17365.
  • 11:10 AM: Nifty made a high of 17507.

Will Nifty reach the second target of 17562?

To become a subscriber, subscribe to our free newsletter services. Our service is free for all.

Continue reading