
NSE NIFTY – Premium Setup
 Unlock This Article
Only subscribers can read the full article. Please login to read the entire article.
NSE NIFTY – Weekly Trading Updates
Do you remember NSE NIFTY’s Wave Outlook?
Visit here: NSE NIFTY – Elliott Wave Outlook
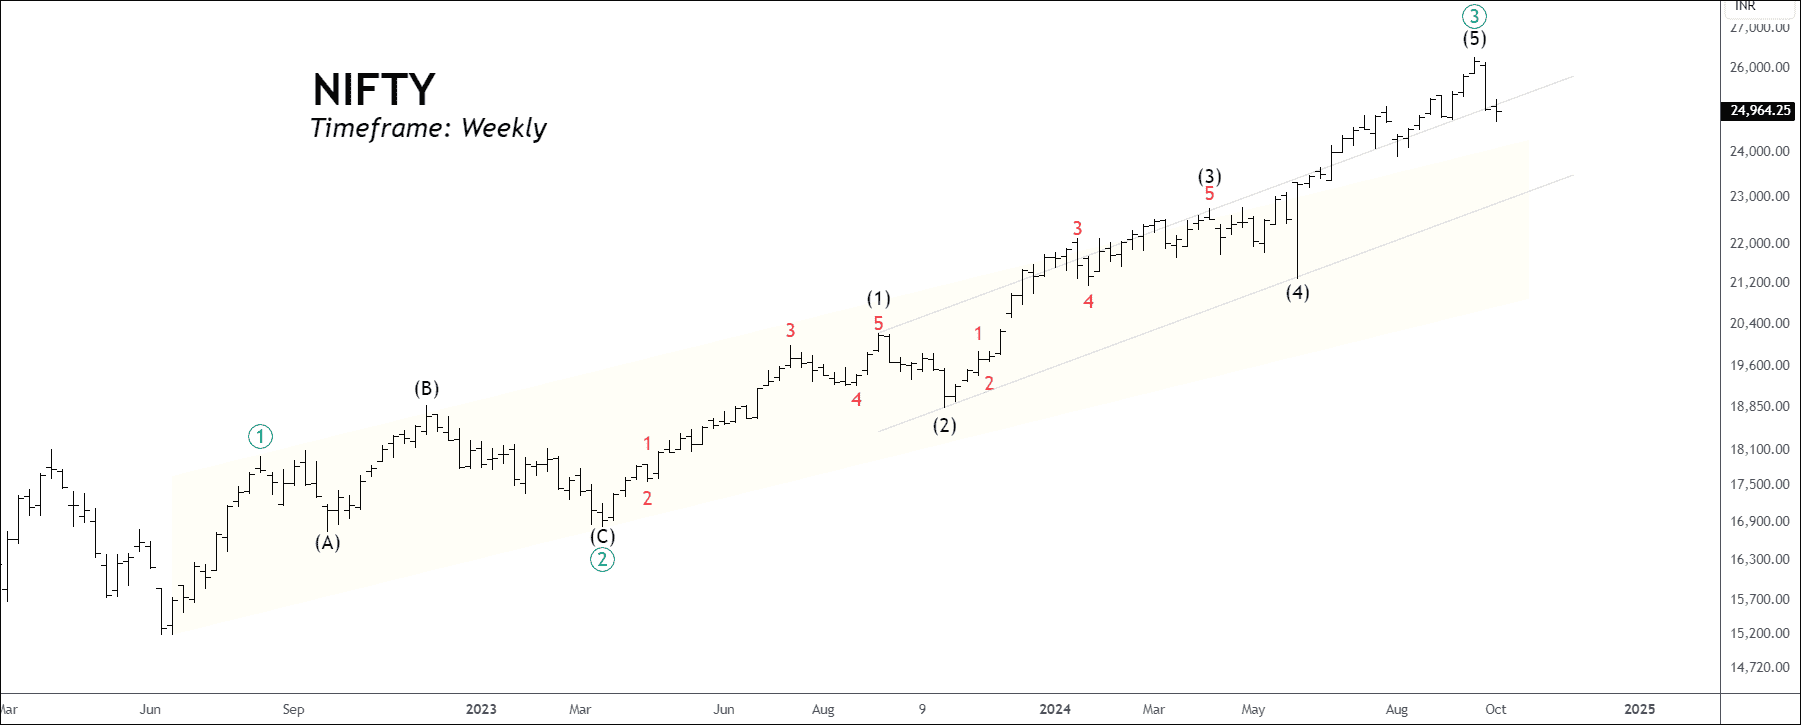 BEFORE
We had written clearly, There’s a risk of the nifty to fall for deeper correction as per the weekly timeframe; bearishness may lead to 22000.
 AFTER
AFTER
NIFTY – A Falling Knife or the Ultimate Holy Grail?
NSE NIFTY, BANKNIFTY & FINNIFTY – Premium Outlook
NSE NIFTY – Weekly EW Outlook
Only subscribers can read the full article. Please login to read the entire article.
NSE FINNIFTY – Weekly Elliott Wave Outlook
Only subscribers can read the full article. Please login to read the entire article.
NSE BANKNIFTY – Premium EW Outlook
Only subscribers can read the full article. Please login to read the entire article.
