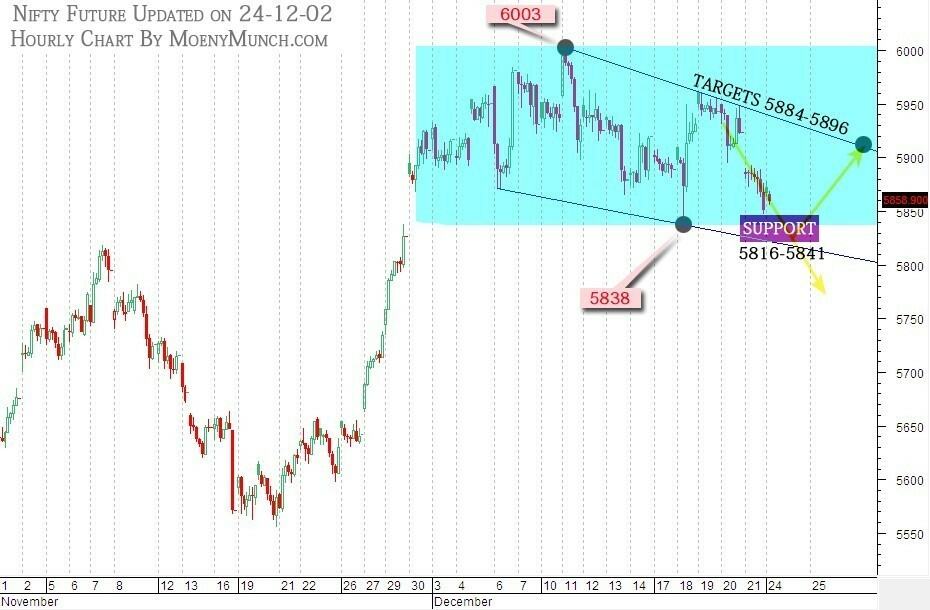
Stock Market Weekly Report

The Indian stock market declined for second consecutive week tracking weak global shares after

a Republican proposal to deal with a US fiscal crunch failed to get enough support, deepening

uncertainty over the US can avert the “fiscal cliff” of automatic spending cuts and tax increases

set to start Jan. 1. 

Some key highlights during the week

•  The RBI kept repo rates – the rate at which RBI lends to banks—and cash reserve ratio (CRR)

unchanged. However, the central bank has hinted that it may cut policy rates next month. The

government’s bold declaration not to exceed the original borrowing target of Rs.5.7 lakh crore

for the current fiscal has been a great comfort for the banks. 

•  Global rating agency Standard and Poor’s (S&P) has said it expects India to grow by 6.5%

during 2013, amidst the possibility of global economic recovery continuing during the year. 

•  Foreign direct investment inflows into India jumped 67% in October to $1.94 billion, a

government statement said on Friday, but inflows for the current financial year were still down.

Total FDI inflows in the first seven months for the current fiscal year that began in April were

down 42% from a year earlier at $14.79 billion.

•  India’s holding of US government debt securities has declined for the second consecutive

month, even as many other countries including China, Japan, Brazil and Russia hiked their

exposure to American treasury bonds. As per the latest data released by the US Department

of Treasury, India’s holding of treasury securities stood at $58.9 billion (over Rs 3,20,000

crore) at the end of October 2012 — marking the second straight month of decline after an

uptrend for seven continuous months. However, the holdings of countries like China, Japan,

Brazil, Switzerland, Russia, France and Canada rose during October. At the end of the month,

India was the 18th largest holder of the US treasury bonds, while China was the largest

foreign owner of these securities followed by Japan, Brazil, Taiwan, Switzerland, Russia,

Luxembourg, Hong Kong, Belgium and the UK in the top ten.

•  The Government lowered the growth projection  for the current financial year to 5.7-5.9%,

while pitching for supportive monetary and fiscal policies to improve investor confidence. The

economy, it added, would have to record a growth rate of 6% in second half of the current

financial year to reach the desired growth rate. It grew by 5.4% during April-September 2012-

13. The economic survey had pegged the growth rate at 7.6% for this fiscal. To achieve 5.7-

5.9% growth, the analysis said, “both fiscal and monetary policy, however, would need to be

supportive to sustain investor confidence.  The government will also have to address the

concerns relating to structural supply side bottlenecks”. 

US Markets

US markets weakened this week, as a new setback in talks to avert a U.S. fiscal crisis and

evidence of Europe’s ongoing economic difficulties stoked investor nerves.  For the week, the

three major U.S. stock indexes posted gains, with Dow Jones up 0.4%, S&P 500 up 1.2% and

Nasdaq Composite Index up 1.7%.

Key Highlights during the week:

•  The December 2012 Empire State Manufacturing  Survey indicates that conditions for New

York manufacturers continued to decline at a modest pace. The general business conditions

index was negative for a fifth consecutive month, falling three points to -8.1. The new orders

index dropped to -3.7, while the shipments index declined six points to 8.8. At 16.1, the prices


The markets may remain volatile next week as traders roll over positions in the F&O segment

from the near month December 2012 series to January 2013 series. The near-month December

2012 derivatives contracts expire on Thursday, December 27, 2012. Investors are likely to keep

a close on watch on the developments on the US ‘fiscal cliff’ which could especially affect

software service exporters such as Infosys and TCS. Indian companies will start unveiling Q3

December 2012 results from mid-January 2013. 

To become a subscriber, subscribe to our free newsletter services. Our service is free for all.
Continue reading

TATASTEEL NSE Stock Future (21-12-2012)

This is just a brief comment on TATASTEEL NSE Stock Future  to let you know that This stock is trading at tops of resistance as seen chart. There are two step for Sell TataSteel, 1st Step of Sell is showed in chart at 435 and finally, you can sell 444.

TATASTEEL-NSE-Stock-Future

TataSteel is trading up-trend of flag as showed in chart. after breaking down 424 and close below it… free fall to 414-409. Just watch Chart Careful and finally decide your targets.

share market tata steel

Daily chart of  Tata Steel shows a bullish “W” pattern. Price sustaining above 426 will keep the bullish momentum intact. Next resistance is at 447.

current share price of tata steel

Just in case I wish everyone a wonderful Merry Christmas.

Enjoy the weekend

To become a subscriber, subscribe to our free newsletter services. Our service is free for all.

Continue reading

Nifty Future Trading Calls for Today

nifty futures tips


THOUGHT FOR TODAY
Cooking and Eating
Cook and eat with powerful vibrations. By placing great importance on cooking and eating with loving and peaceful vibrations, you will nourish both mind and body.

Nifty Future Tips

(Updated on 21-12-2012 at 07.40 AM)

Yesterday written that break below 5930 expect

5915-5895. 5895 is crucial support and Nifty fut

took U turn kissing 5895.10.

Now for Today…

5895-5886 intraday and crucial support

If breaks below 5886 and sustains with

vol then slide up to 5866-5850.

5944-5958 intraday hurdle.

crossover with sustained vol may take 5985-6005

Two consecutive closing below 5866

then correction may extend up to 5805-5780.

To become a subscriber, subscribe to our free newsletter services. Our service is free for all.

Continue reading

Nifty Future lead to a bigger move?

Comparison of Nifty Spot with difference indexes…

nifty comparing with dow jones

Nifty future and Indian VIX with Moving average of Nifty future…which in Sell mode.

nifty vix

NIFTY Daily chart shows a range at the top. Break of the smaller range may lead to a bigger move

nifty trading range

To become a subscriber, subscribe to our free newsletter services. Our service is free for all.

Continue reading

It’s time for you to get in the game (Exide Industries limited)

It’s time for you to get in the game

For days, we have been highlighting to our readers and Subscribers about few stocks like PFC, Century textile, etc. Today, I will guide Exide Industries limited (Symbol, Exideind) NSE stock Future.

The current trend is down and our orders on the buy side may be considered which is 139-144 as seen in chart. Short Term traders can enter in long side with this stock above 139 only.

Now, level of 139 is very important for buyers, Suppose not break below… and continue trade for targets 156 and 161-162

 Exideind

To become a subscriber, subscribe to our free newsletter services. Our service is free for all.

Continue reading

M&M (NSE Stock Future) Updated on 20-12-2012

M&M is trading long term uptrend as per seen in chart of daily view. You can trade between 941 to 946 for long side…

Suppose to trade below it or close… then free fall you will see to 929-917… therefore keep stop loss in mind.

sell M&M

To become a subscriber, subscribe to our free newsletter services. Our service is free for all.

Continue reading