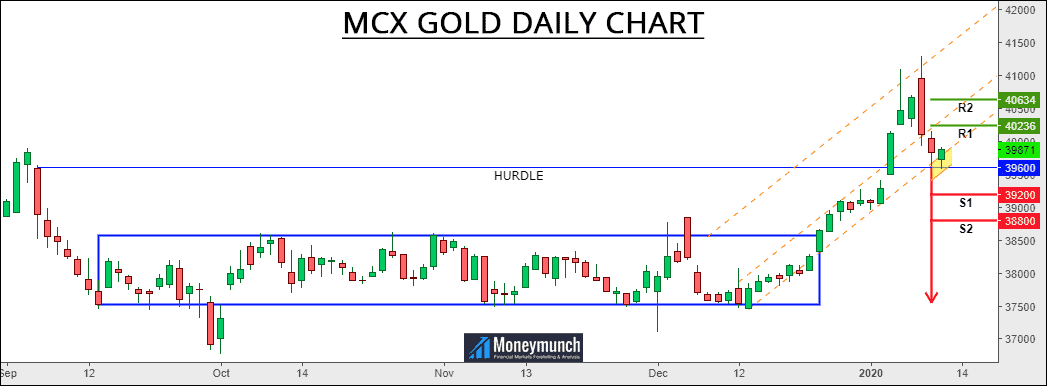
The Prospects of Gold’s Next Upswing
As per the chart, the uptrend trendline breakout means gold will explode. That can up fall up to 39760 – 39632 – 39500.
It happens in complete breakout only. With the uptrend line, following levels are awaiting ahead: 39960 – 40040.
To become a subscriber, subscribe to our free newsletter services. Our service is free for all.
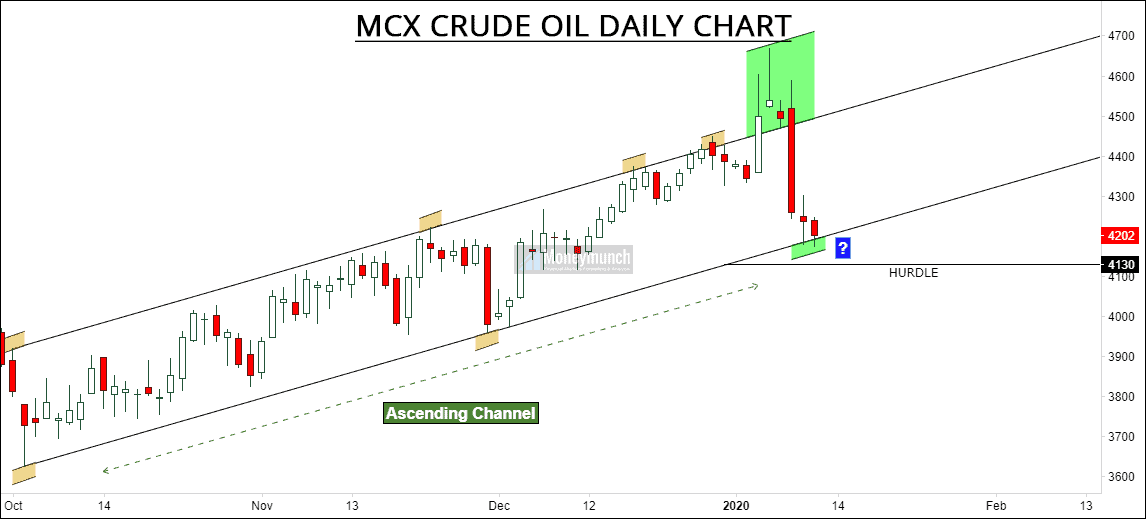
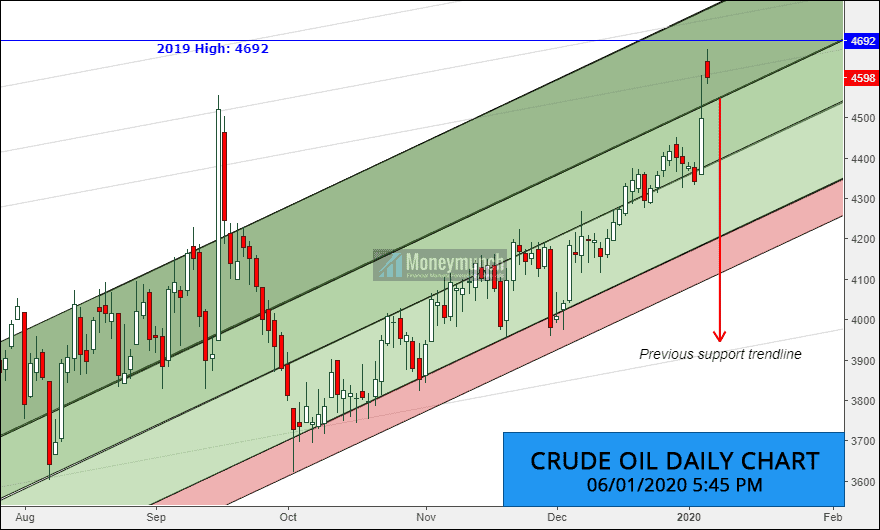
Overall, Crude Oil Price Begins To Move Higher?

Long-term Potential for Natural Gas Remains Strong!
Hurdle: 148
Level 132 is the next confirmation level to continue the downtrend. It could be up to 128 – 120 – 112.
Continue reading
 Unlock This Article