 Unlock This Article
Only subscribers can read the full article. Please login to read the entire article.
To become a subscriber, subscribe to our free newsletter services. Our service is free for all.
Continue reading
Get daily free stock, commodity, and forex trading tips and research reports. Know the latest markets trends, trading strategies, and make profitable trades with Moneymunch.
To become a subscriber, subscribe to our free newsletter services. Our service is free for all.
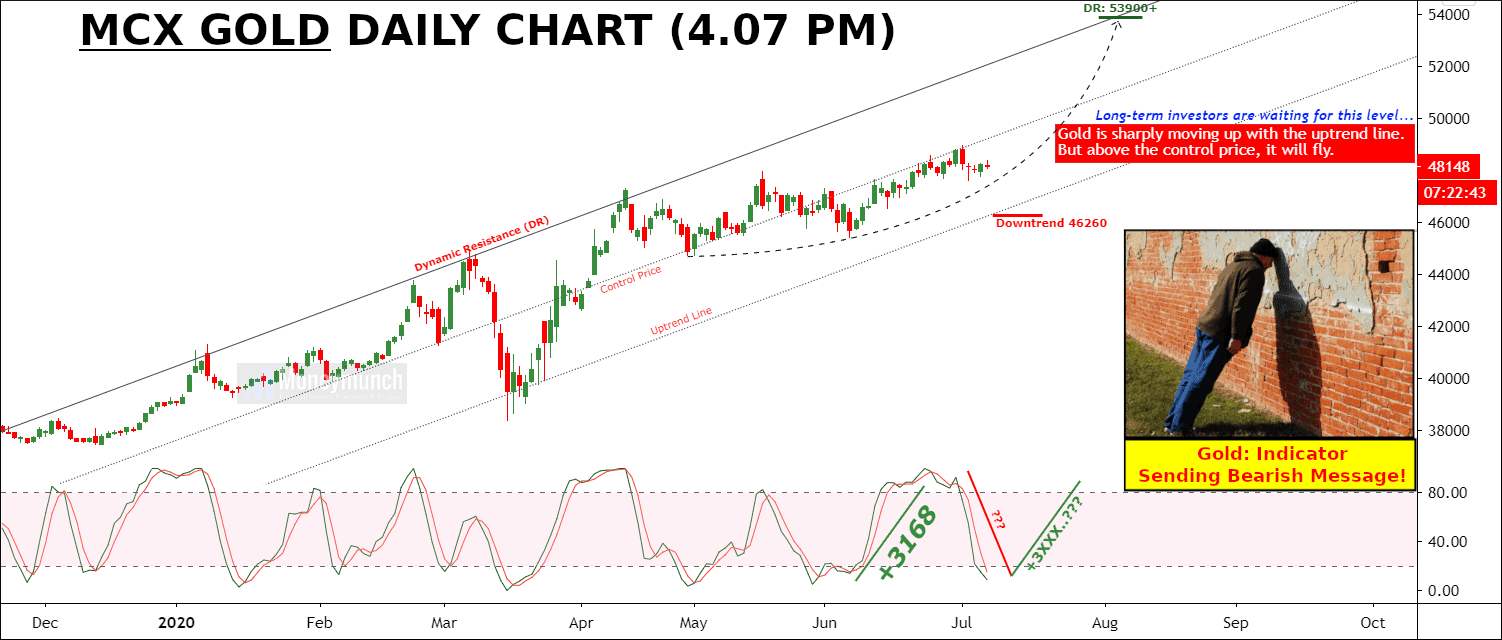
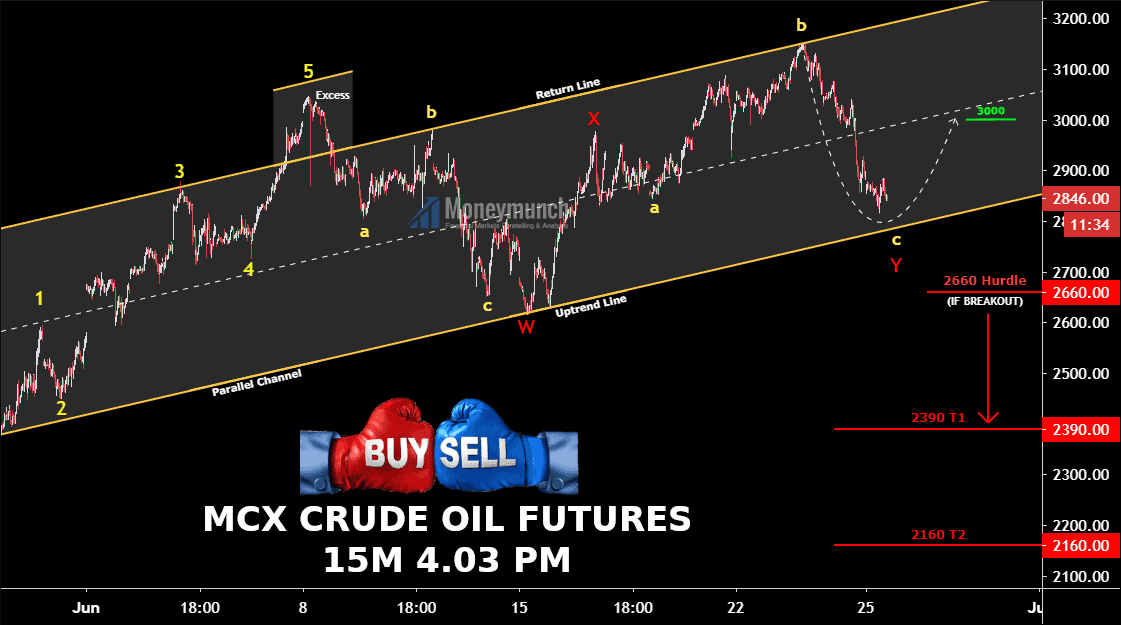
As per the chart above, gold is trying to take a U-Turn. It can slip for 47460 – 46760 – 46260 levels.
As per the S-RSI, it will start running upside soon for the dynamic resistance level of 53900. Hence, targets: 49560 – 50000 – 52000 – 53000+
Don’t forget to keep your eyes on downtrend level 46260.
To become a subscriber, subscribe to our free newsletter services. Our service is free for all.
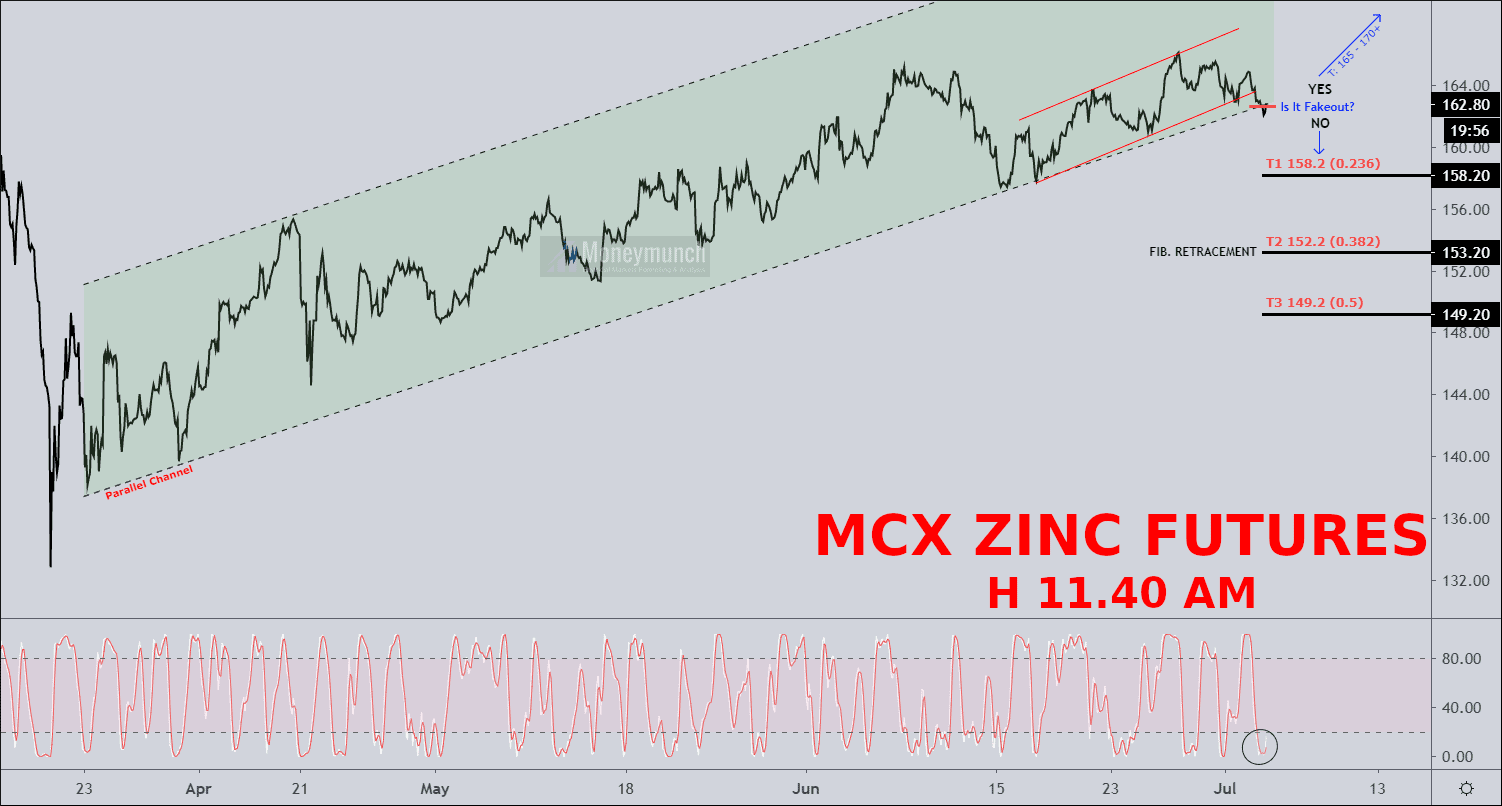
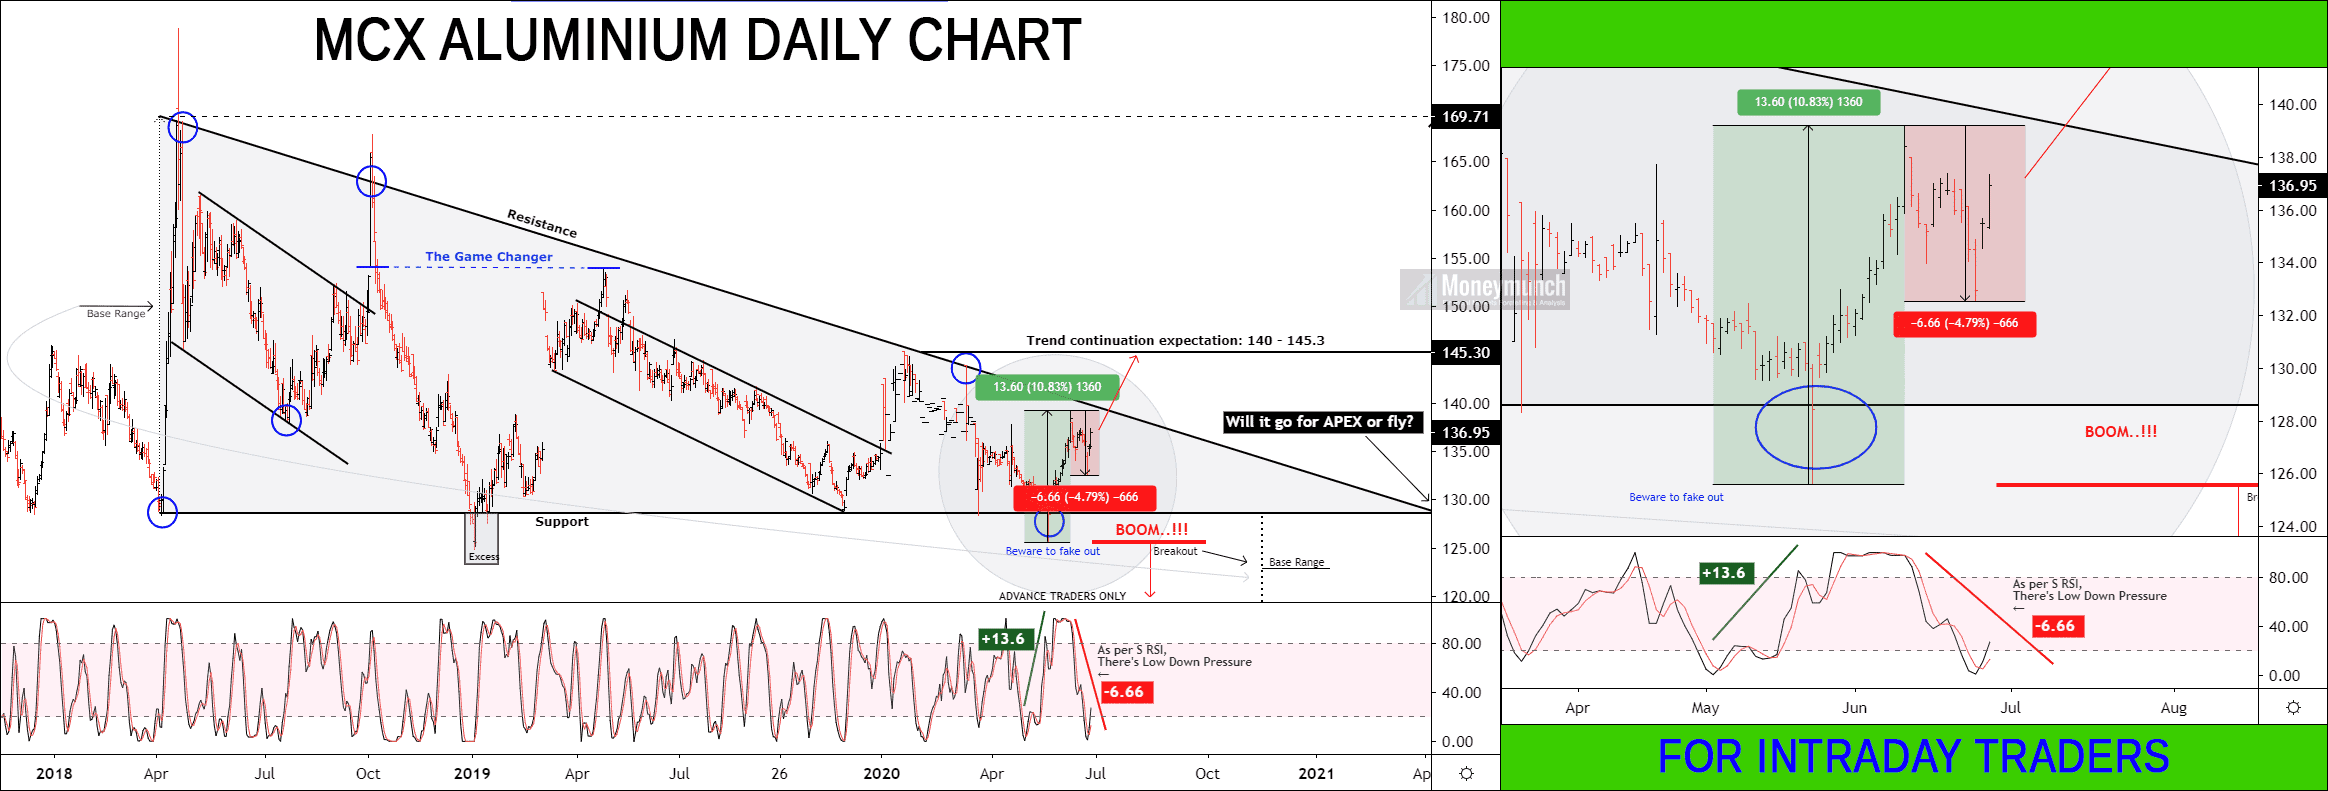
As per the above chart, the parallel channel’s uptrend line can use as a stop loss.
Hurdle: 162.6
Based on the current trend:
Uptrend targets: 165 – 170+
Based on Fib. Retracement:
Downtrend targets: 158.2 – 152.2 – 149.2
To become a subscriber, subscribe to our free newsletter services. Our service is free for all.
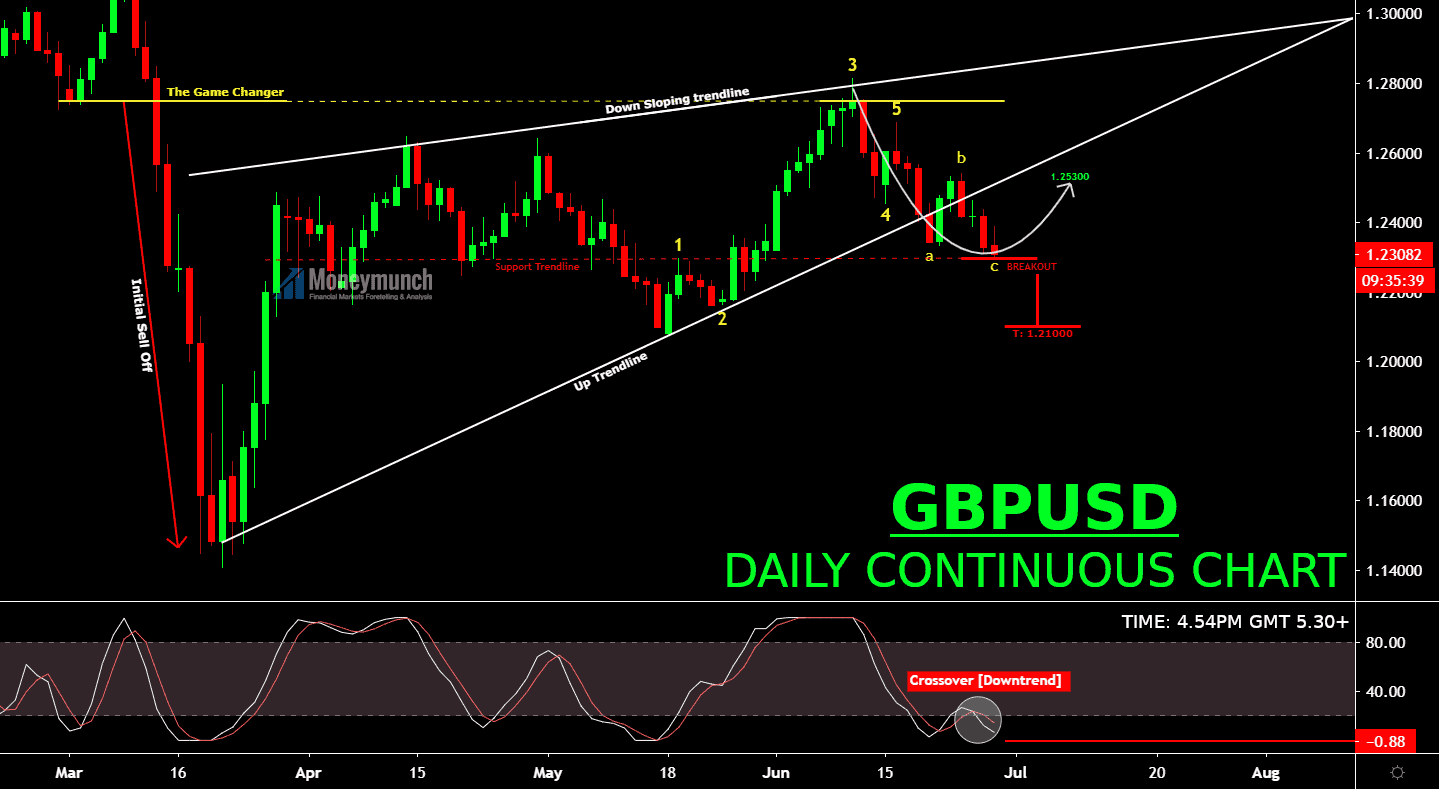
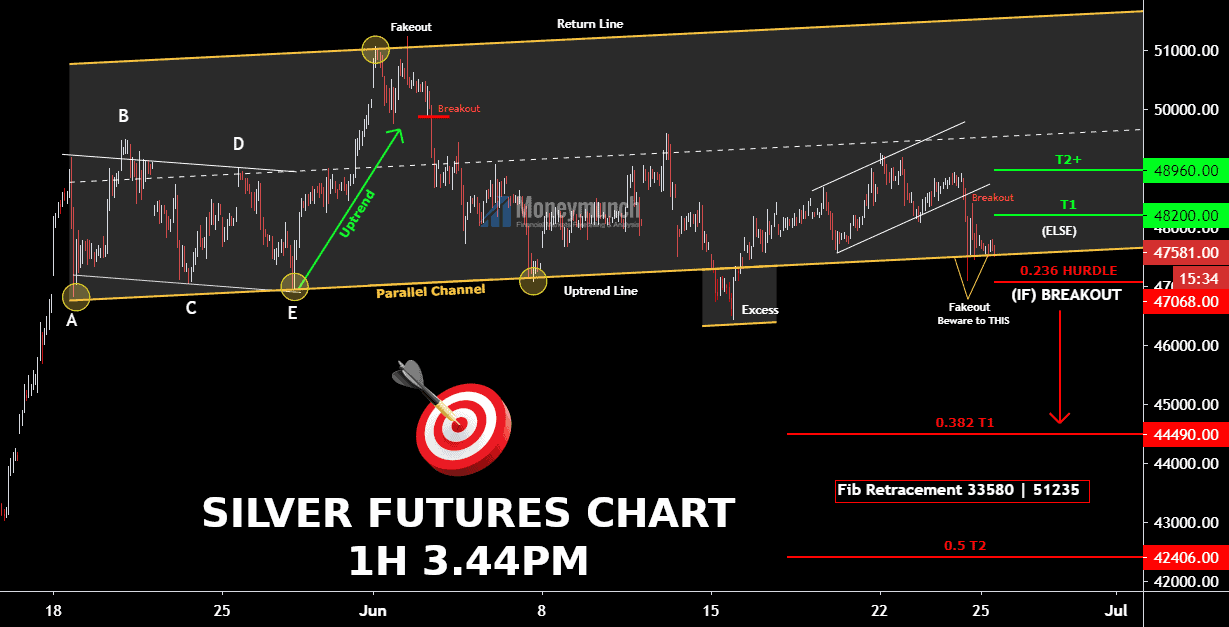
Keep your eyes peeled at the support trendline. It could fly from here for 1.25300 level. But this can happen only after two consecutive positive close.
As per the S RSI, it’s under downtrend. Hence, complete breakout means a direct target of 1.21000.
Note: beware of fake out.
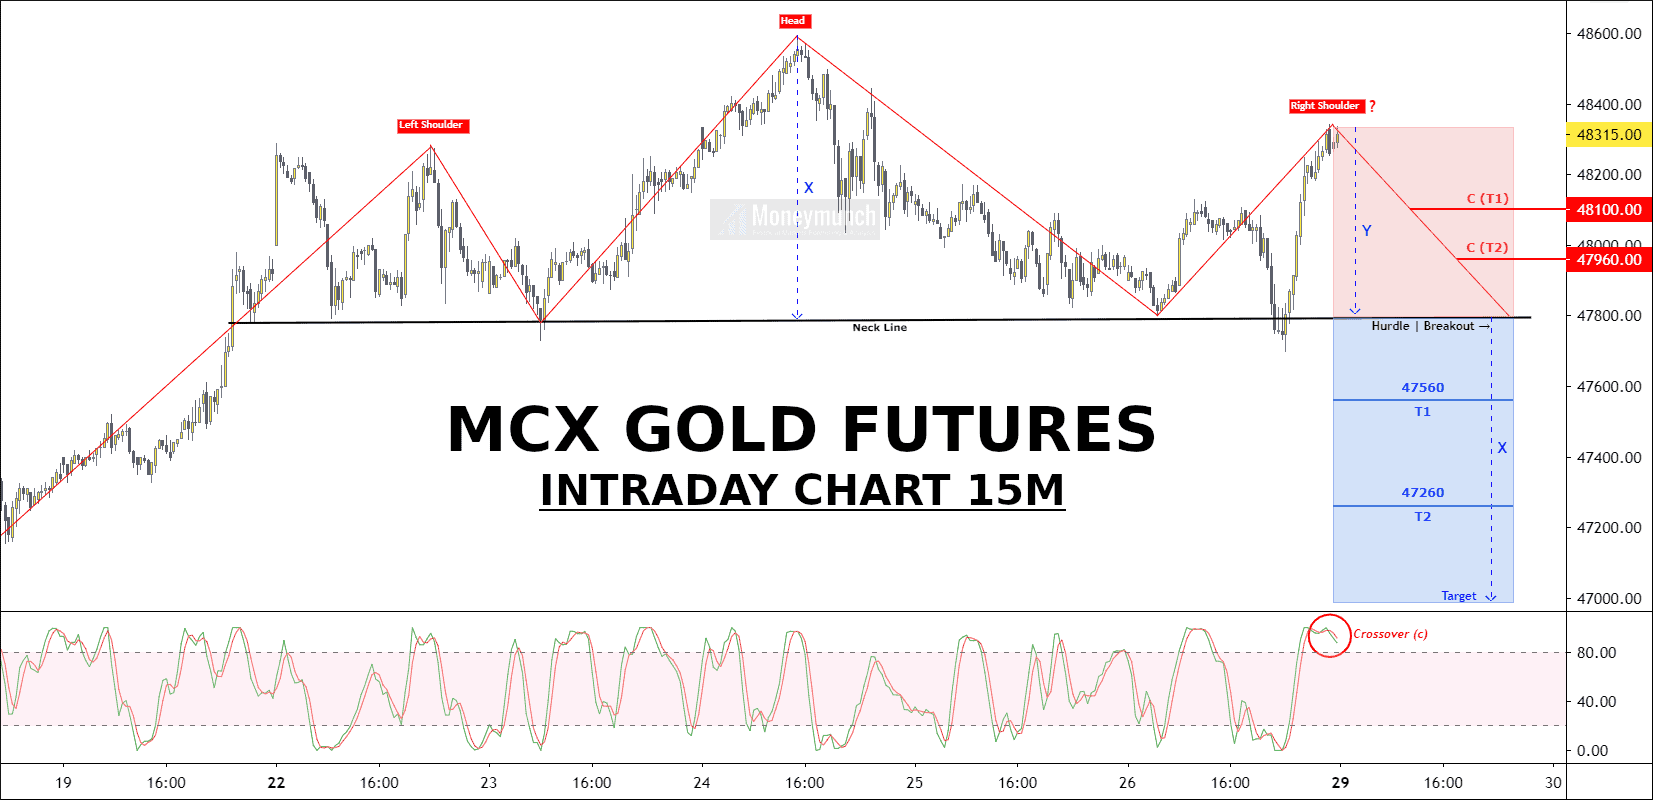
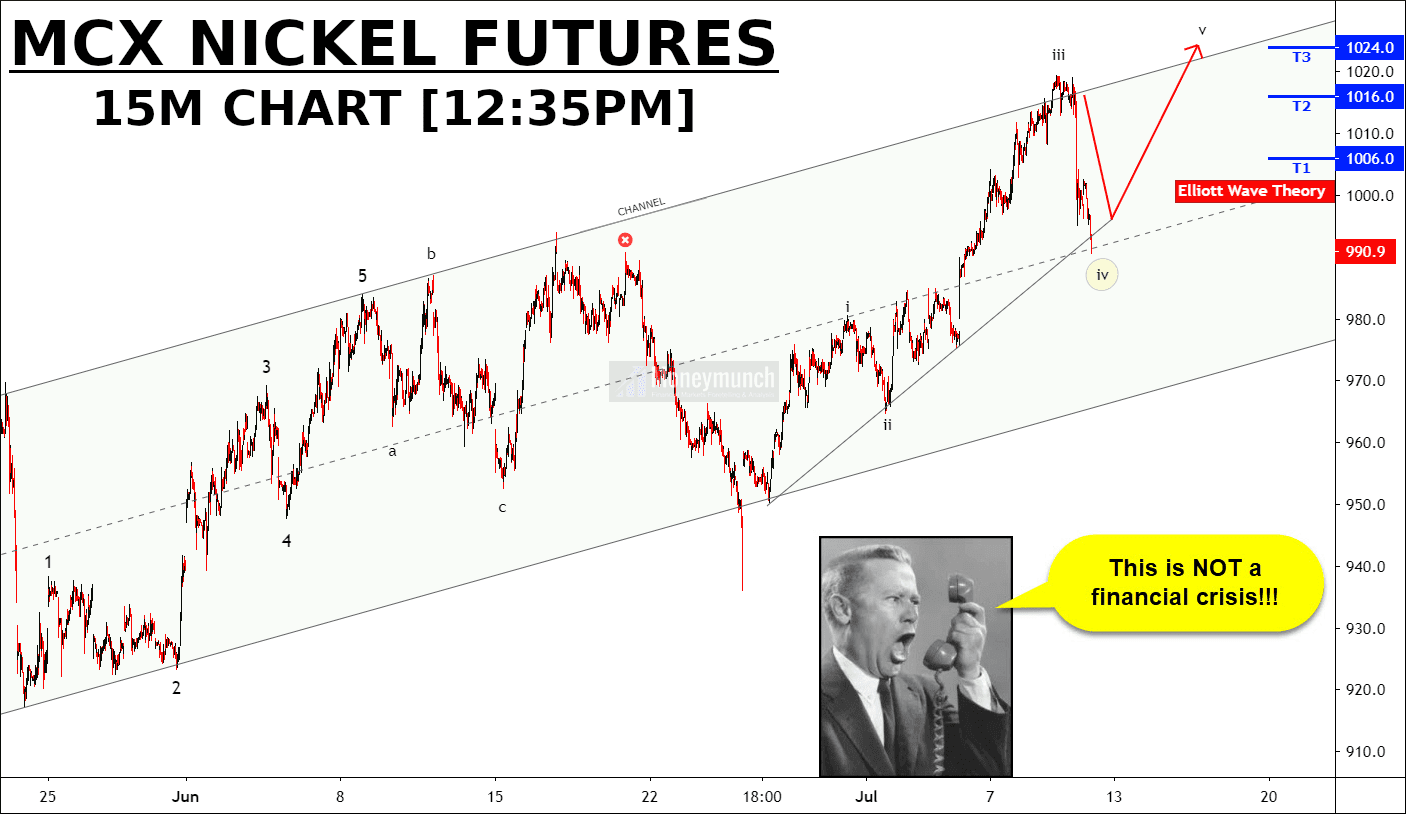
Gold has made a new high as per the last update based on Elliott wave theory. You can check the last updated chart: This GOLD Elliott Wave Will Confirm The Next Move
For intraday traders:
If that is a right shoulder, C (T1) and C (T2) are the next targets. S RSI is confirming the downtrend by crossover.
For the long-term investor (Hurdle Breakout):
T1: 47560
T2: 47260
T3: 47000
Invalid: Above 48400 OR Head.
To become a subscriber, subscribe to our free newsletter services. Our service is free for all.
To become a subscriber, subscribe to our free newsletter services. Our service is free for all.