Unlock the potential of bullion trading with our expert tips and analysis. From gold to silver, our research reports cover all aspects of the market to help you make informed decisions and maximize your profits.
You know, world’s fastest growing market is commodity market and in it crazy movers are Gold and Silver. One more thing you should to know, ‘The major monetary metal in history is silver, not gold’. Remember, your TV is lying to you when it says the ‘demand for Gold and silver’ is decreasing. Anyway, stop struggling and start making money with me.
Let me start with Crude oil. First, click here and read our crude oil report now. Okay, now I hope you got it what I want to say you. Go and sell crude oil with targets: 4861-4841-4800. Contract changed that’s why little levels will change. Yes, stop loss and exact levels for subscribers only!
Unlock This Article
Only subscribers can read the full article. Please login to read the entire article.
I think, should not say more about MCX Gold after above chart.
First click here and read our past natural gas report with chart. If MCX Natural gas not close below to hurdle 178.5 then it will kiss 190-200-214+. On this 21st, Natural gas was kissed our first target!
NCDEX Jeera is very crazy item in Angri commodities. Free readers, I am just your well-wisher and want to say you. Today it’s looking downward. More information about Jeera to subscribers only.
SILVER, ZINC & JEERA REPORT IS BELOW. FOR TO SEE It Log IN NOW AND ONLY SUBSCRIBERS CAN READ IT. To become a subscriber, subscribe to our free newsletter services. Our service is free for all.
Unlock This Article
Only subscribers can read the full article. Please login to read the entire article.
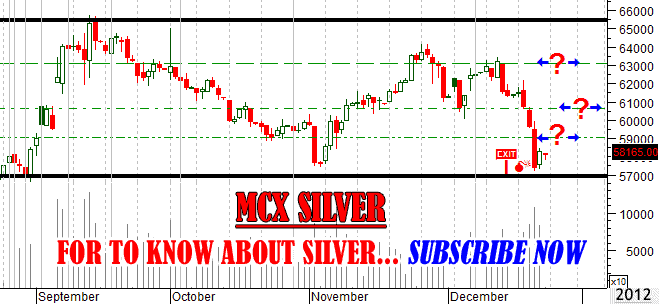
Yesterday what I said about Silver? Click here to see it I said,”Once silver touch our hurdle then you can sell it with targets: 62627-62400 and Our hurdle was 62952“ All targets blasted in 1 hour. What else you want huh? Our subscribers are minting money day by day and what about you huh?
Yesterday I also said about Mentha oil First click here and read it I said,”sell mentha oil at opening bell with targets: 1418-1411-1403“ At morning time, our subscribers sold mentha oil @ 1428 and booked profit at 1418. Yesterday without break our Stoploss, menthe oil kissed two times our first target. Smart traders enjoyed and losers continue watch Pogo!
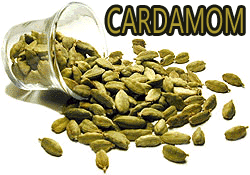
Yesterday I said about MCX Cardamom and I hope you remember. If don’t then take one hammer and hit on your head. I had written, “Play safely and earn easily. S/L is 908. Targets: 890-881-873“ Cardamom touched first target and missed 1 rupee to kiss second target. Today I expect, it’ll finish every target.
To become a subscriber, subscribe to our free newsletter services. Our service is free for all.
Let’s make beautiful day. Lion heart traders, are you ready for take risk? Start trading with MCX Silver. You can buy silver with targets: 63575-63775-63817 Hurdle: 62952 Once silver touch our hurdle then you can it with targets: 62627-62400 Choice is yours! To become a subscriber, subscribe to our free newsletter services. Our service is free for all.
Let’s we start to talk about Mentha oil. It’s looking downward for today. You need to watch it ride because it’s very important. Just sell it at opening bell. Targets: 1418-1411-1403 S/L is 1440 level. Remember stop loss is required, and it’s quite risky.
MCX Nickel is playing both ways. Intraday traders for great opportunity available in Nickel and in coming days it’ll make unbelievable movement. Really sorry to say, but I’ll say about Nickel to subscribers only.
Play safely and earn easily. S/L is 908. Targets: 890-881-873
I said, “You can buy silver. Targets: 63370-63574-63775-63875 Hurdle: 62857 Remember, hurdle is a very important thing here. Once silver cross and close below to hurdle then it may kiss 62391-62134“
Silver crossed and closed below to our hurdle and Kiss our all targets on 30 Nov at night! I am sure everyone enjoyed my free calls.That was only trailer, movie aajse suru hoga. To become a subscriber, subscribe to our free newsletter services. Our service is free for all.
Unlock This Article
Only subscribers can read the full article. Please login to read the entire article.
Note: On 29th Nov I also said about Crude oil, but it was opened upside, not downward. And same on cardamom.
Silver and Gold: Who want to earn from Bullion sector? Keep in mind below levels and hurdles. I seem for markets that are trading in fairly dependable ranges where support and resistance levels hold up very well. Today how to play with silver? You can buy silver anywhere. Targets: 63370-63574-63775-63875 Hurdle: 62857 Remember, hurdle is very important thing here. Once silver cross and close below to hurdle then it may kiss 62391-62134.
MCX Gold rest over. Now it will take U-Turn and learn you lot in future…
Keep your eyes on crude oil opening bell. Once open downside then you can sell it. Big profit opportunity. Targets: 4790-4758-4736 Remember opening bell is very important thing here
Let me introduce with one superb hot item. It’s a Cardamom! Go and buy it without targets: 991-908-1001 [Remember opening bell should be upside]
To become a subscriber, subscribe to our free newsletter services. Our service is free for all.
We’ve been surprised at the recent action in the precious metals complex. During the recent correction the shares were showing quite a bit more strength than the metals. Then the shares took a dive below support yet the metals maintained their recent lows! How do we interpret this wild volatility in the relationship between the shares and the metals? Quite often we look at daily and weekly charts. Now is the time to take a look at the monthly charts which can help us get a better read on the larger trends at hand.
The monthly chart of Gold shows the yellow metal in a very healthy consolidation between $1550 and $1800. Gold’s current retreat from $1800 has lasted two months. Back in 2009, Gold brokeout to a new all-time high in the seventh month of its consolidation. Presently, Gold’s bollinger band width is at a multi-year low and its three-month volume average is at a two year low. Also, the RSI has bottomed and made a higher low. Even if Gold touched $1600, it would remain in healthy position for a breakout in 2013.
Gold’s companion Silver is currently trading in a tighter consolidation with $35 as resistance and $27 as support. Note that Silver has tested and held above $27 six times in the last fifteen months. Silver also held above the rising 40-month moving average which supported the market in 2009 and 2010. The RSI has also made a higher low and volume has trended down during the past seven months.
Meanwhile, the gold stocks (HUI) look weaker than the metals. Momentum hasn’t confirmed its bottom as the market is in a clear range from 400 (support) and 525 (resistance). Note the current 11% decline in the HUI for the month while Gold and Silver are still in positive territory. Nevertheless, if and when the HUI prints a monthly close above 525, this chart would like quite bullish and general sentiment would certainly pick up.
The evidence argues that the bottoms remain well intact and the metals are consolidating before the next breakout which entails Gold breaking $1800 and Silver $35. However, these breakouts are by no means imminent. Since we are dealing with monthly charts that means potentially three or four more months of consolidation. Furthermore, sentiment data such as the COT structure and public opinion polls need some improvement before the market could sustain a breakout. Thus, more consolidation could be the order of the day for the metals.
Continued consolidation in the metals also helps explain recent weakness in the HUI, which is simply testing the lower half of its own consolidation. The shares see the weakness in the overall market and perhaps sense that an immediate breakout in the metals is unlikely Furthermore, while central banks have put themselves in position to act they haven’t actually done anything yet. When the market senses their action it will likely mark a final low within this consolidation.
The good news is the metals remain in fine shape and so to do most of the mining equities we follow. If we are indeed correct that the metals and shares will remain range bound then your task is simple. Prepare yourself for further consolidation by having your buy list ready and then be ready to act when the time comes. A wise friend once told me that in a bull market the goal is to accumulate positions at the lowest prices possible. With mining equities trading well off their highs, now is the time to do your research and find the companies that will lead the next leg higher and outperform the gold stock sector.

 Unlock This Article