Will Gold (XAUUSD) Reach $2050 Before December 2022?

free forexcurrency xauusd gold chart calls

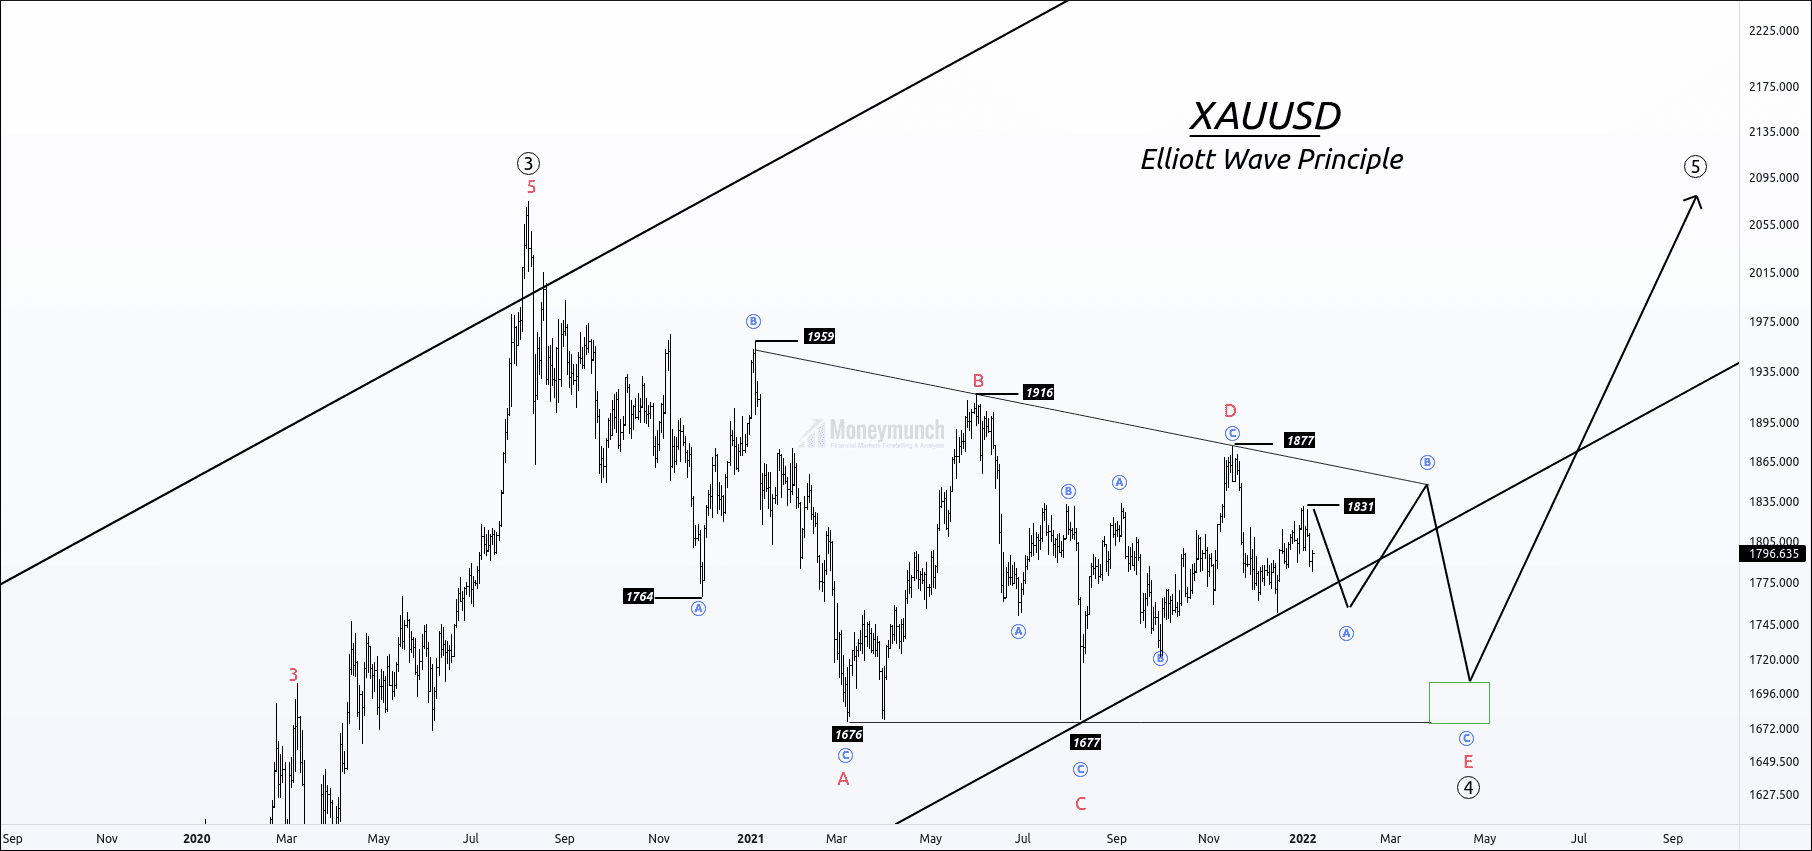
XAUUSD is forming a triangle on the wave ((4)).

This correction has taken more than 17 months, but the triangle is not over yet. Price has completed wave D of the 4th wave triangle, and wave E of wave A is in progress.

After completing the wave sub-wave A, the price will start wave B & then wave C.

The ending point of wave E is the starting point of the impulsive cycle.

Calculation of wave E:

Wave E can end 100% of wave sub-wave A at 1726.

Wave E can end near previous sub-wave B at 1719

Wave E can end at 100% of wave D at 1704.

Traders can wait for the breakout of the B-D trend line. Note that if the price doesn’t break the B-D channel, sideways will be continued.

To become a subscriber, subscribe to our free newsletter services. Our service is free for all.
Continue reading

Gold Price 2021 Roadmap – EWT

free commodity gold chart tips

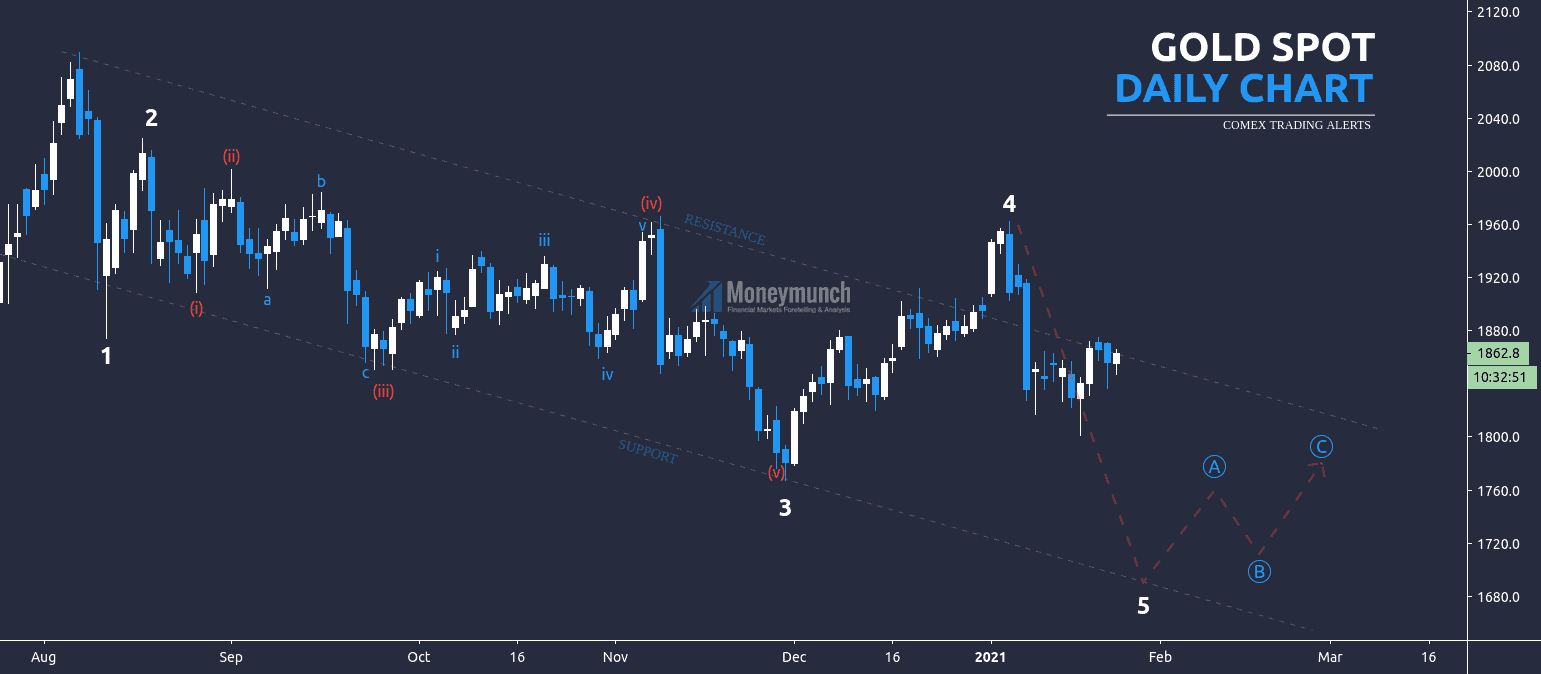
The Gold spot started the bearish Elliott wave on the daily timeframe. Right now, it’s making the 5th wave. It has to cross 1824 – 1800 – 1776 to complete the fifth wave. The fifth wave will complete around 1690.

If there will be the upside breakout of wave 4, then it’s a failure of the Elliott wave pattern. And the target for the uptrend will be as following 1980 – 2000.

To become a subscriber, subscribe to our free newsletter services. Our service is free for all.

Continue reading

COVID-19 impact on the Indian financial markets, and precautions.

Coronavirus disease (COVID-19)All sectors of Indian financial markets are getting impacted by COVID-19. The total number of 123 countries are affected by a coronavirus. 1.32L+ confirmed cases and 4.9+ thousand people’s deaths reported by this virus.
Data source: WHO (World Health Organization) & National Health Commission of the People’s Republic of China

Not only the Indian market, all over countries’ financial markets fear over this virus. It foothold is everywhere. But it will impact on a particular sector only. Many stocks & commodities will hit the bottom level. Isn’t it a new opportunity for smart traders? Don’t get scared. Don’t divert stocks from a portfolio without in-depth research. Fluctuation is temporary. It’s time for a new buying opportunity.

Hint: oil and manufacturing
To get the best stocks and commodities tips for investing in the current market situation, subscribe now.

Coronavirus disease (COVID-19) Help and Information

Coronavirus information – India
The Helpline Number for coronavirus: +91-11-23978046

Coronavirus disease (COVID-19) advice for the public

Continue reading

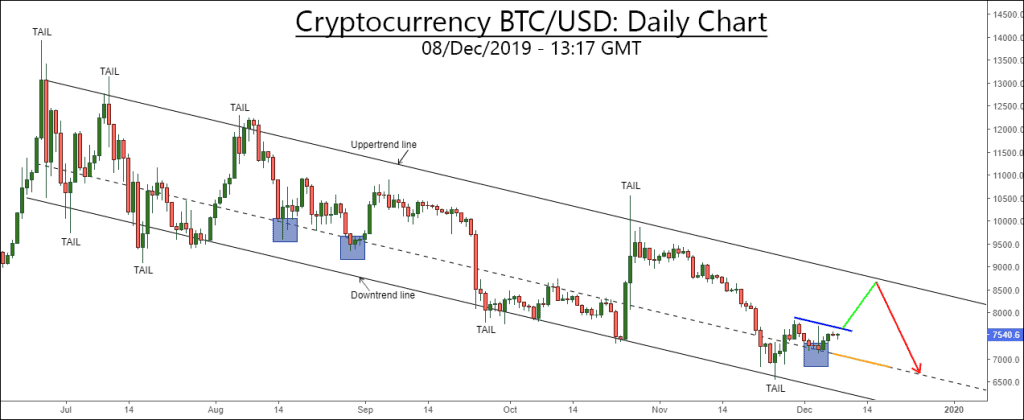
Cryptocurrency BTC/USD is Turing up

free forex btc usd trading alerts

As per the chart, Bitcoin can move upside up to 8200 – 8400 after breakout of the blue line.

Overall, it’s under downtrend. BTC/USD will fall soon for 7000 – 6500 – 6000 below levels. Follow the upper trend line for accurate entry.

Additional: start making the short position below the orange line for the above targets

To become a subscriber, subscribe to our free newsletter services. Our service is free for all.
Continue reading

UPDATE: USD Index reverse mode activated?

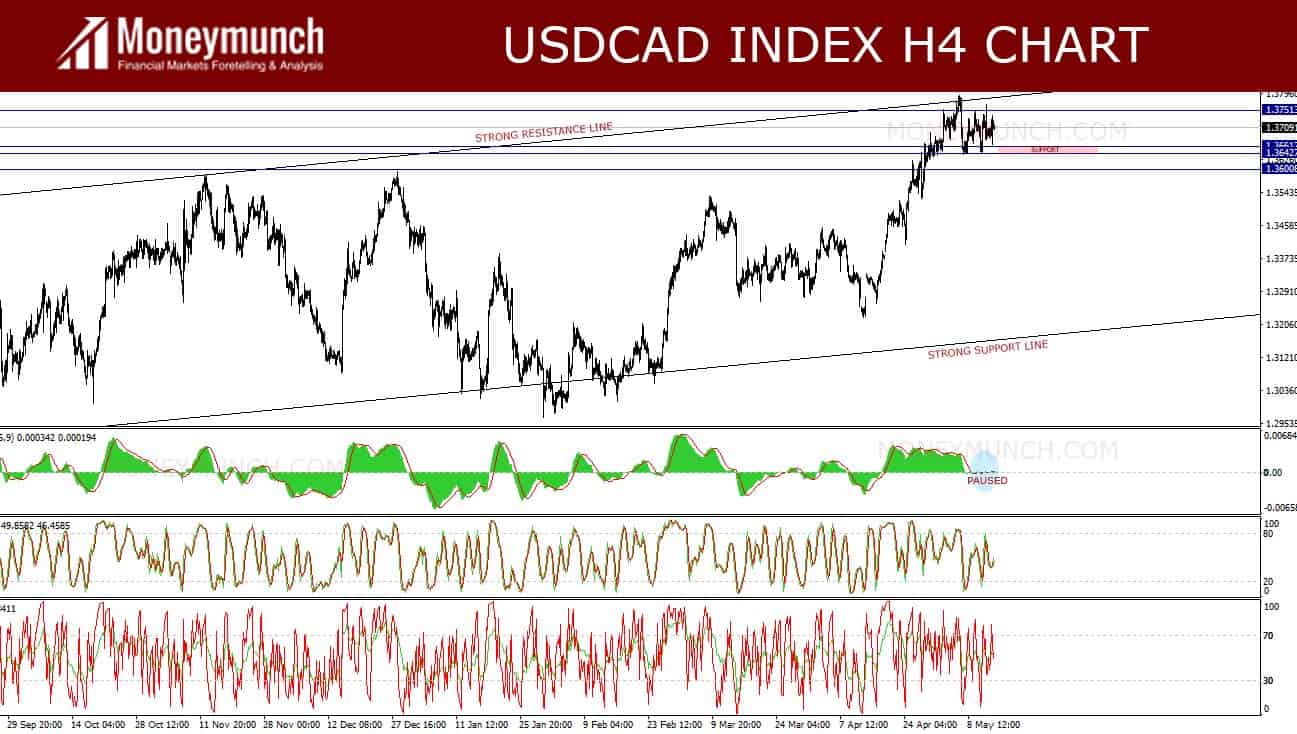
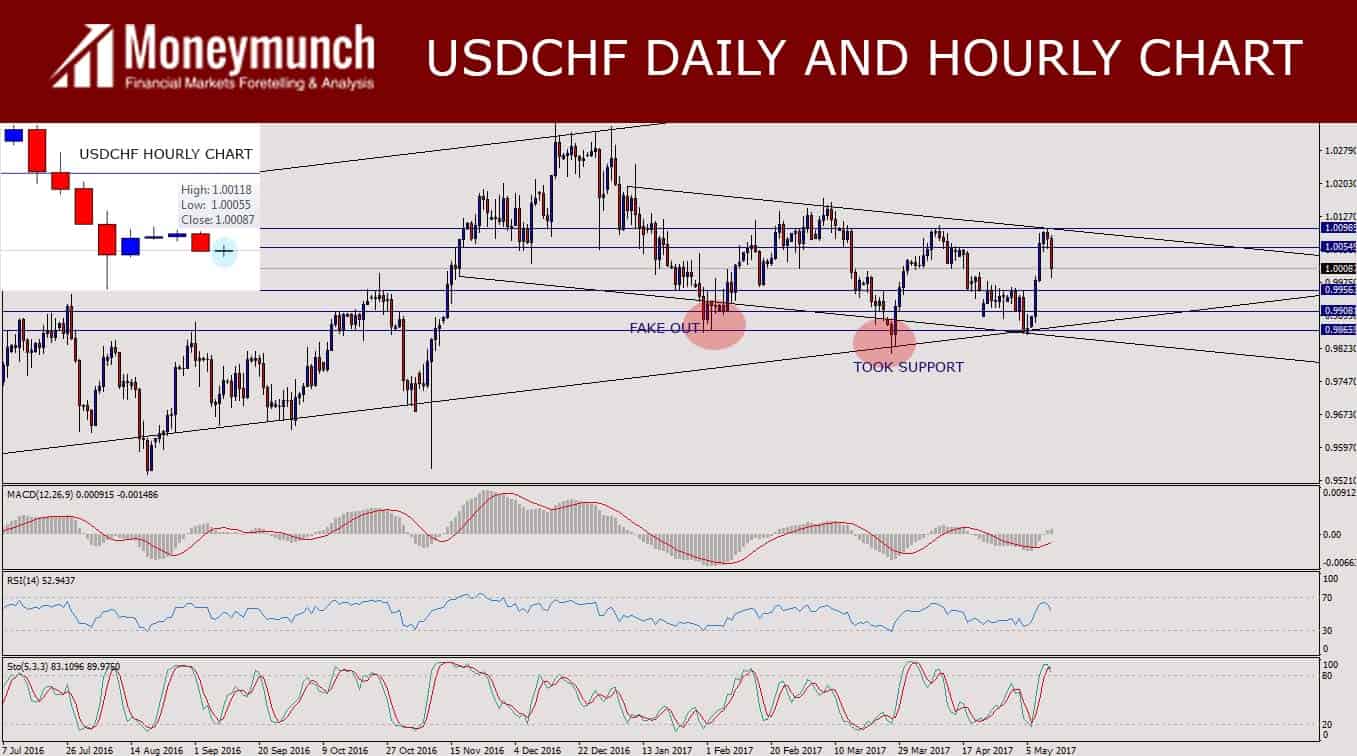
What had I Said about USDCAD and USDCHF Index (Date: 15-05-2017 @ 03:31 AM, GMT +5:30)?

USDCAD

I had said “USD/CAD has paused after sharp reversal off 1.32604. Hourly resistance is given at 1.37513.
You will see 1.366169- 1.364266- 1.36008 levels soon.”

USDCAD HIT ALL TARGETS (1.366169- 1.364266- 1.36008levels).

USDCHF”

I had strongly said
“I will not take your much time. Just keep in mind these levels: 0.99563-0.99081-0.98655.
Resistance: 1.00549.
Must note: USDCHF long-term, Technical structure favors bullish bias.”

USDCHF TOUCH TWO TARGETS 0.99563-0.99081levels.

Continue reading

USD Index reverse mode activated? – FREE Forex Signals

Are you reading Moneymunch Forex articles over 8 months? Do you remember GBPUSD long-term report?
Just click here if you forgot that.

I had written article about GBPUSD index @24th October 2016
”GBPUSD index was a failed attempt to recapture high; you had seen it cascade lower.
GBPUSD index (6/10/2016) is clues that the trend down was coming to end here, you will see 1.24324-1.27744 – 1.30560 levels soon.
Keep in mind MACD and RSI waits for up-signal, if GBPUSD crossover or closes below 1.18872 level you may see 1985 year’s low.”

IF GBPUSD index Cross or close below the trending support line indicate further weakness.

free forex tips

USD/CAD has paused after sharp reversal off 1.32604. Hourly resistance is given at 1.37513.
You will see 1.366169- 1.364266- 1.36008 levels soon.

free forex tips

I will not take your much time. Just keep in mind these levels: 0.99563-0.99081-0.98655.
Resistance: 1.00549.
Must note: USDCHF long-term, Technical structure favors bullish bias.

Continue reading