Nifty Option trading: April Is Important

nifty-future-live

INTRADAY TARGET ACHIEVED

Buy NIFTY call 7700 (CE) 52 to 58 targets 76(if cross this)… then targets 90 to 116 and stop loss 48

To become a subscriber, subscribe to our free newsletter services. Our service is free for all.

Continue reading

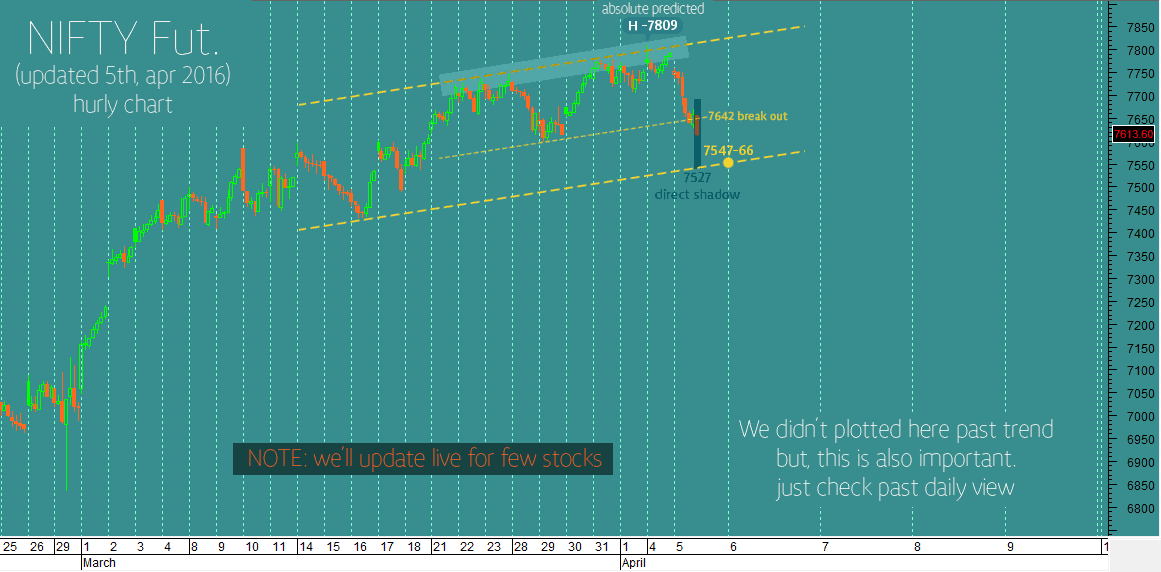
Nifty fut updated with new trend channel

We’ve been on an absolute tear on NIFTY future @7797 with high of it.
31st, mar 2016 trade alert was short (resistance) 7797 around.
Traders who acted at our resistance had the opportunity to secure up to 200 points profit.

nifty-future

Just watch carefully, because this is new trend channel and past update is important if you want to trade CLICK HERE

To become a subscriber, subscribe to our free newsletter services. Our service is free for all.

Continue reading

Commodity MCX Cotton, CPO & Cardamom intraday trading tips

FREE MCX Cotton tips

Whenever I see the moves of cotton, I remind one thing what Warren said, “I will tell you how to become rich. Close the doors. Be fearful when others are greedy. Be greedy when others are fearful.”

Now, I don’t think I need to explain more about cotton. On last week cotton had gained 470 rupees, and yesterday it earned 140 points, so I should recommend to intraday trader to go with it for 16426-16474 levels. Lion heart traders can hold until cotton break 16540 levels.

INTRADAY TARGETS: 564-567
SHORT TERM TARGETS: 573+
STOPLOSS: YESTERDAY LOW FOR FREE READERS

MCX CPO Intraday Tips
mcx cardamom intraday tips

FOR DAY TRADERS TARGETS: 658-644
SHORT TERM INVESTORS MAY UNTIL IT BREAK 621 LEVELS.

PERFECT ENTRY LEVEL & STOPLOSS SUBSCRIBERS. To become a subscriber, subscribe to our free newsletter services. Our service is free for all.

Continue reading

CRUDE OIL TIPS: Bearish Pressure Remains

FREE Crude oil intraday tips

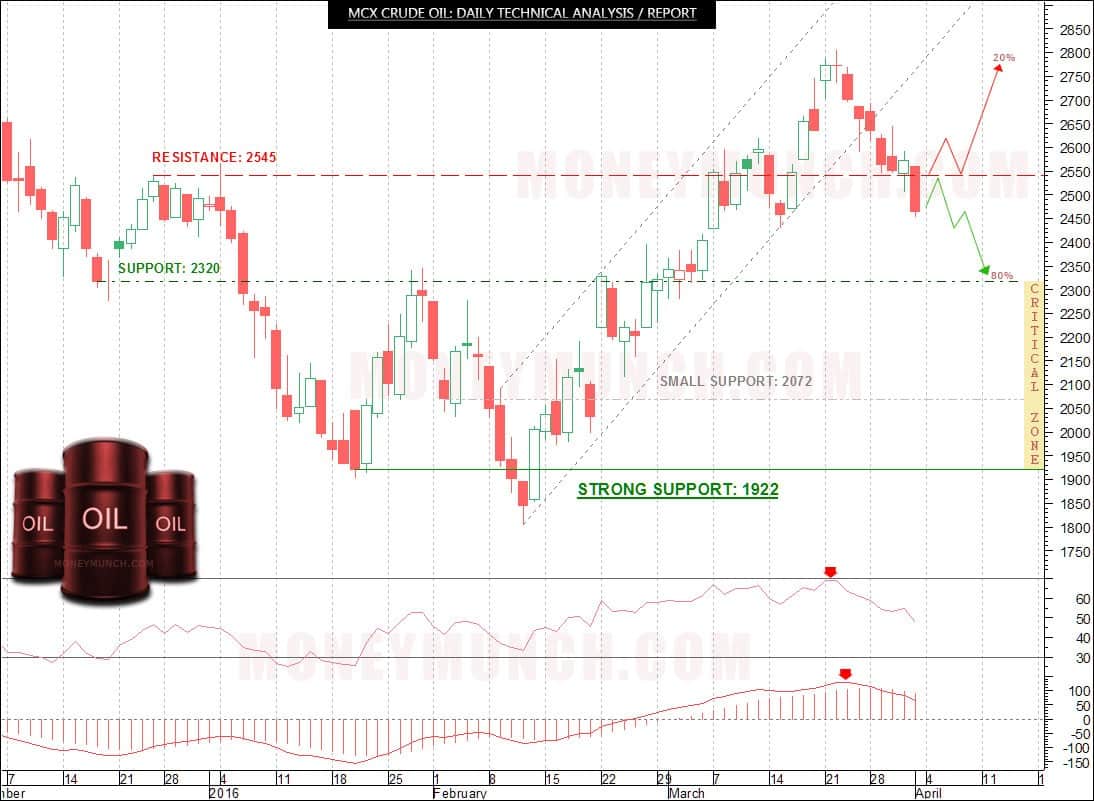
On last week crude oil lost almost -212 points and on previous trading session it had lost -97 rupees. Look at above chart, MACD & RSI showing down signals. Now no need to explain in-details to smart traders because resistance has been broken and at the present time I look 80% chance to hit first support (2320 level). 

Once black gold comes under ‘critical zone’ then we will see 2072-1922 levels again.

If you would like to buy crude oil, then wait until it crossover the resistance 2545 level OR wait for it to hit support 2320 level one time. If the crude oil breaks resistance and move up, then we will show 2610-2740+ levels.

To become a subscriber, subscribe to our free newsletter services. Our service is free for all.

Continue reading

COMMODITY TIPS & CHARTS: Gold erasing February gains

You would like to take position in Gold / Silver then doesn’t listen to what people are saying about the markets. Look at what the markets are saying as a reflection of people who are actually buying and selling. It is a much more reliable guide.

MCX Gold charts tips views

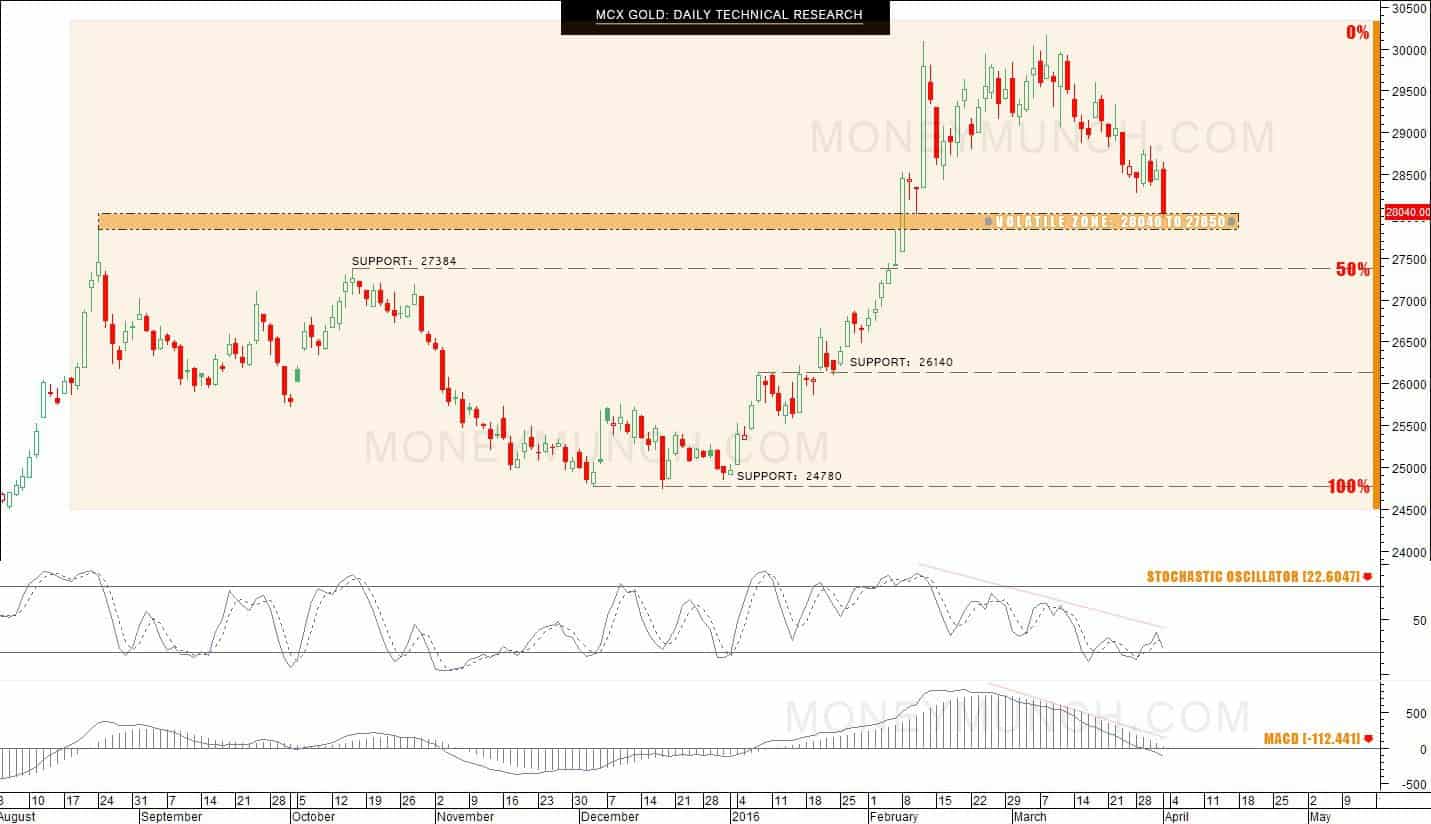
Look at above chart, the March month rally of Gold was very disappointed to buyers. If the gold will hit 50% (support: 27384) and show closes below it then we will certainly see 26140-24780 levels. But the seller must keep his eyes open while it touches the support 27384 level because buyers will try to push the gold up. So I would recommend short term seller should start selling in bulk after crossover the 27384 level and meantime they can sell gold (for intraday trading) while it move down from volatile zone.

Buying opportunity will knock the door while gold stay above the volatile zone levels, and it can break 28600-29000-29500+ levels!

Note: on my last newsletter, I’ve updated about crude oil, copper & lead targets. I’m very glad to inform those all commodities touched each targets. If you missed it then click here and check it now!

To become a subscriber, subscribe to our free newsletter services. Our service is free for all.

Continue reading

FREE Forex signals / forecasts on USDCAD, EURUSD & USDJPY

USDCAD charts with signals & tips

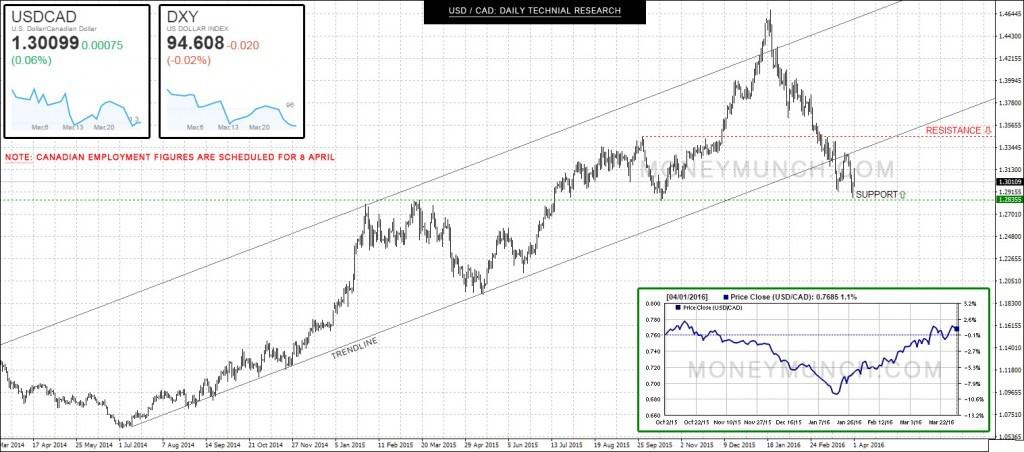
On above USD / CAD chart, you can see this pair is continuing falling since 17 Jan, but it had taken U-turn after hitting the support level (1.28355). I’d recommend buyers to stay in hold. On next week we may see 1.31300-1.33445 levels.

When should I sell USDCAD?
Level: 1.28175
Once USDCAD show closing below to above level or break that level, then you could sell it for 1.26030-1.23810.

EURUSD charts with forecasts & tips

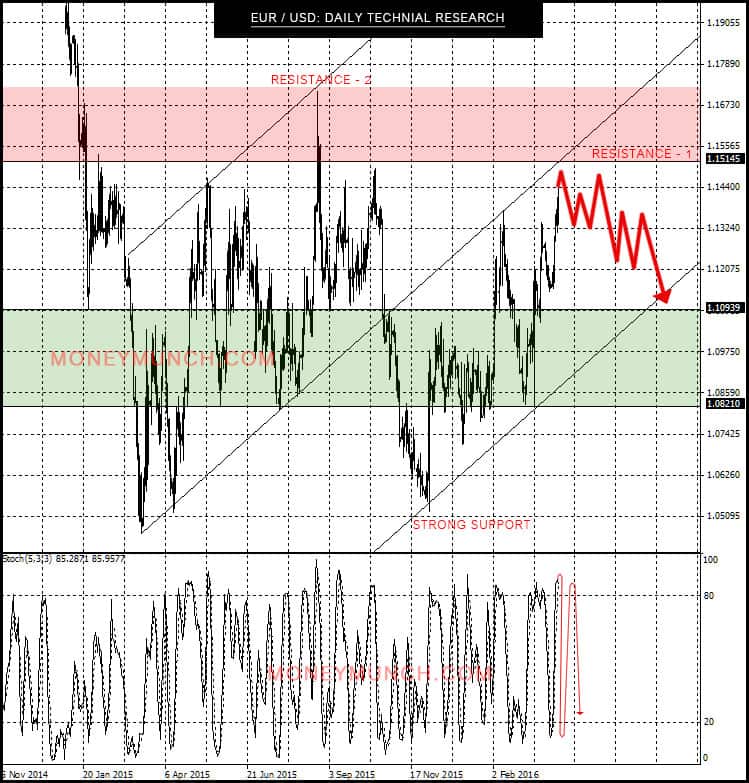
Look at above chart, technically euro is looking weak against American dollar. Short term investors can start selling from Monday opening bell. It may show some up moves, but overall looking downward.

Targets: 1.13200-1.12100-1.11000

Keep note, if the EUR / USD will crossover resistance 1 then it may try to touch resistance 2 so be careful with it.

Long term target: 1.08600

USD JPY tips forecast

USDJPY is planning to take U-turn from Monday opening bell. It could show 111.22 levels, but it’s a trap for day traders. This week we will see 113 levels.

If you would like to dive for long term then 113 levels is best for sellers because USDJPY is overall down for big time.

For long term investors: once the USDJPY will be close below the 111.100 levels then we see 110.08-108.350-105.600 levels.

Continue reading