USDINR & JPYINR: Moving Sharply

jpyinr signals

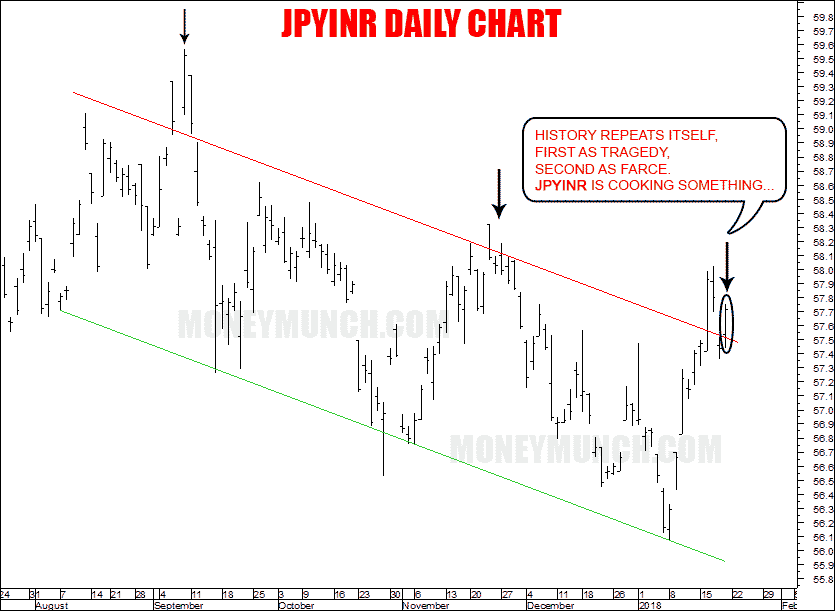
JPYINR – Continued Bullish Pressures

According to secret sources, JPYINR will try to break the 58 level. If this pair will show closing above 58 level, then we may see 58.4-59 levels. And we see closing below the resistance line (red) can be a direct indication it will hit 56.8 – 56.2 levels soon.

usdinr-moneymunch-1-16-14

USDINR – Continued Weakness, But…

Support: 63.75 level
Strong Support: 63.5 level

Supports breakout will indicate a downtrend. I recommend selling after the breakout of support levels.

Targets: 63.15 – 62.6 levels

To become a subscriber, subscribe to our free newsletter services. Our service is free for all.

Continue reading
Sellers have high probability on nifty index as per technical indications

Sellers have high probability on nifty index as per technical indications, therefore PUT of nifty jan. 2018 can buy 21-25 for targets 37 to 41 and after possibility for positional targets as 66-79 in 3-5 tradings days.

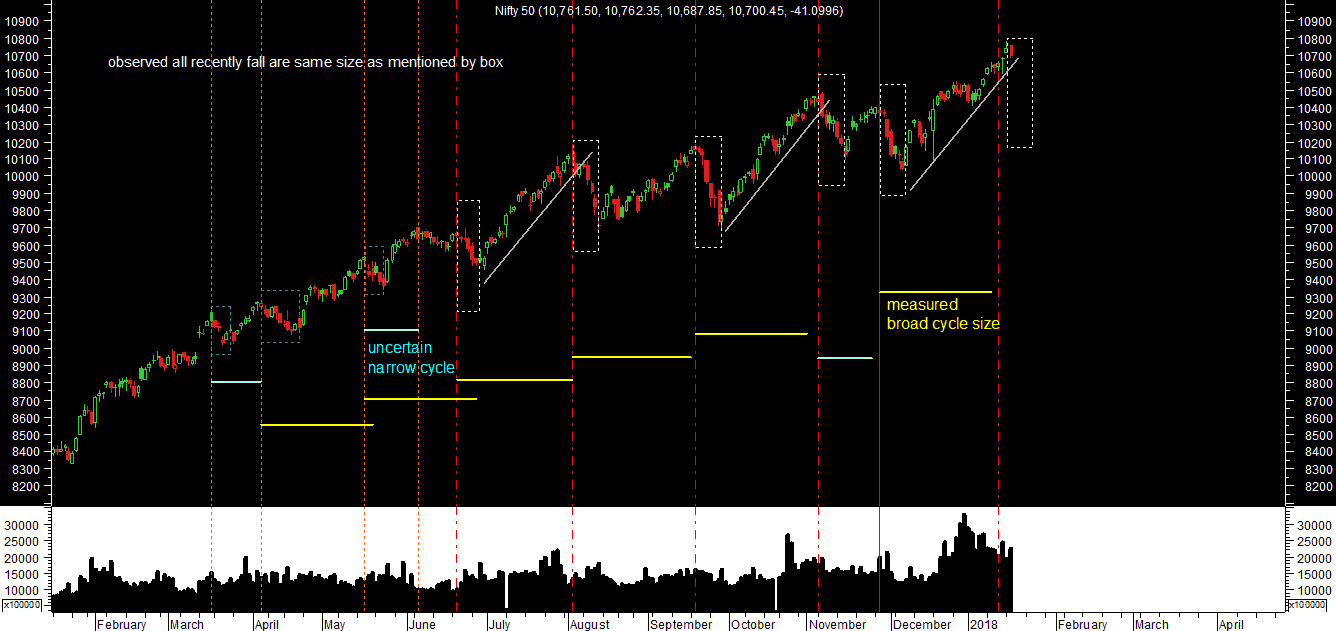
nifty-cycle-analysis

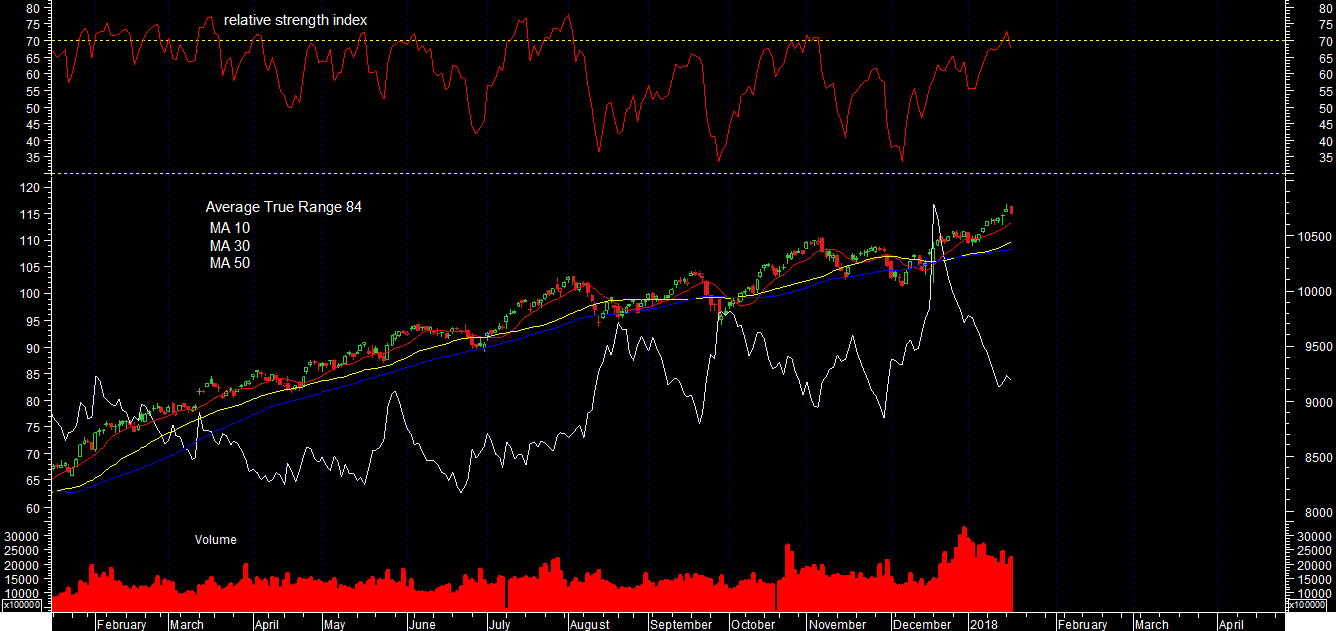
concluded by cycle analysis, it may come 180-300 points fall nifty in period short of time. In the above chart, “measured broad cycle size” is showing that it can fall and also observed all recently fall are same size as mentioned by box. Fall is not far so, be careful if you’re in long side.

  • All below “Moving Averages” are positive but ATR (average true value have strong support which can indicated big move on a day) ATR is at 84 points and today low is 10665 and high is 10754. The result of ATR tells us intraday bulls are over at, 10765.

MA 10
MA 30
MA 50

  • RSI (relative strength index) is representing at overbought.
  • World markets are negative

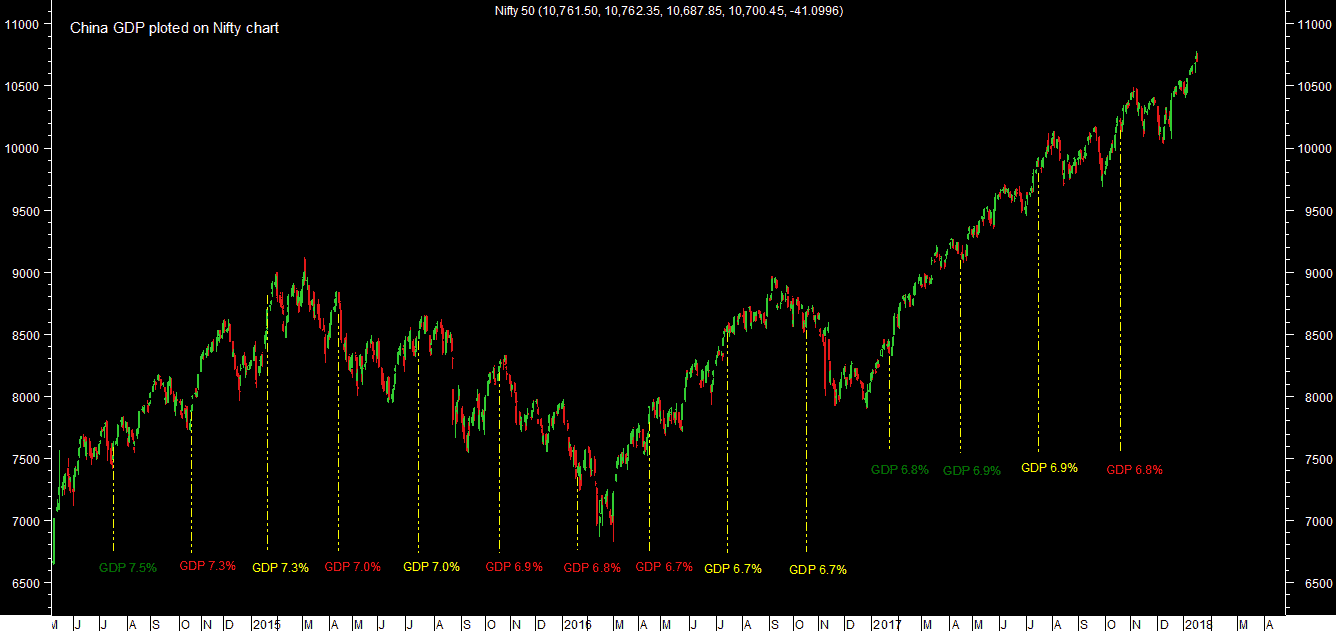
On 18th January 2018, China will declare quarterly GDP which historical GDP of china plotted on nifty for understanding affect of it.

To become a subscriber, subscribe to our free newsletter services. Our service is free for all.

Continue reading
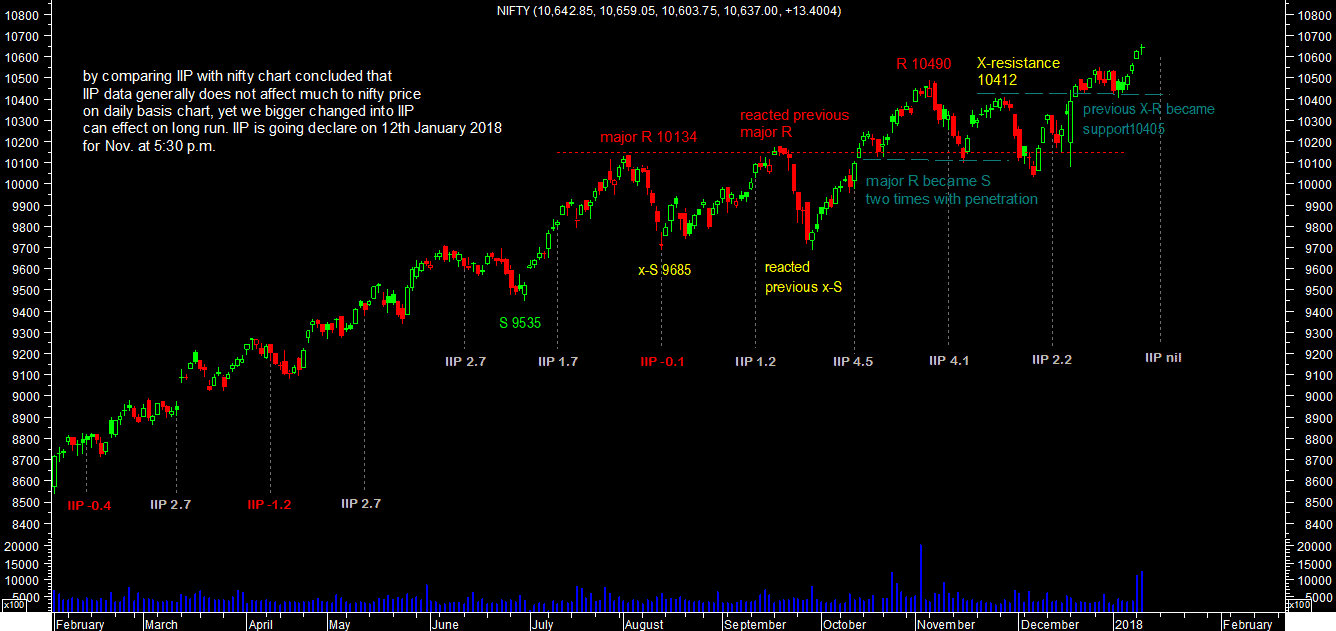
comparison of IIP data with nifty and will declare on 12th Janunary 2018

IIP (Index of industrial production) data for November month and CPI data for December month are going to declare on 12th Jan. 2018 at 5:30 PM which are generally minor affect to index nifty for short term period. Therefore, we have created chart of IIP data with nifty future here will useful for traders.

nifty-chart-with-iip

Data for 01/09/2018

Exp TrendN/A
NIFTY
Open10,642.85
High10,659.05
Low10,603.75
Close10,637.00
Volume1,267,682
Open Int.0
Price Chg.13.40
Vol1,267,682

IIP and CPI data are declare on Friday then result of it will be on Monday. If there’re not good news or unable to support globe atmosphere will lead to fall in market.

IIP data source from.

Continue reading

We have updated overview of nifty

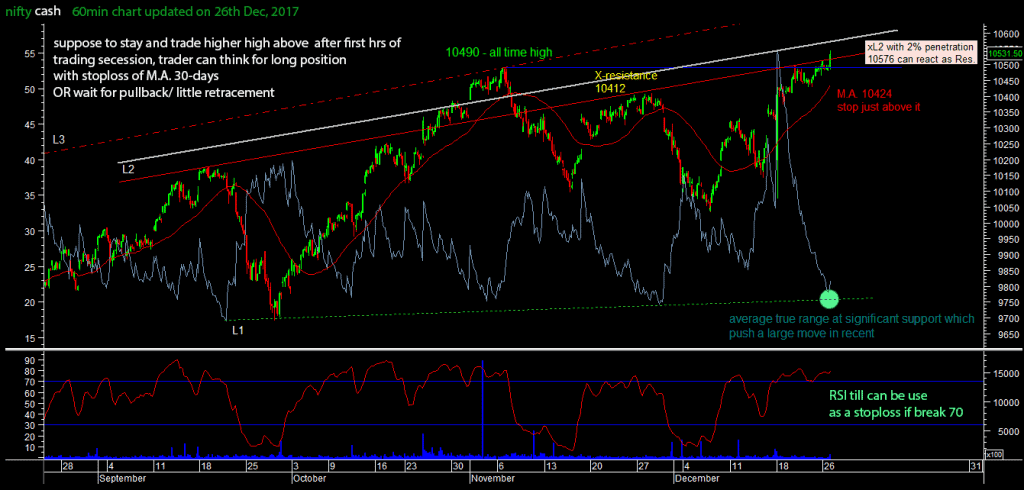
nifty-60-min-chart

NOTE: above chart level are for Nifty Cash market. All levels are use after 1hrs of trading secession.

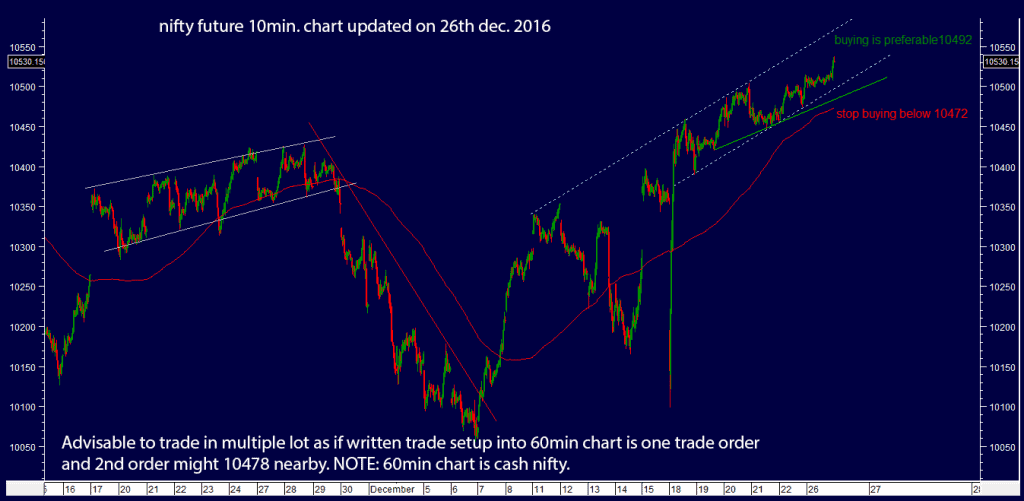
10min-chart

Multiple trade is good, but we will update live more about it.

To become a subscriber, subscribe to our free newsletter services. Our service is free for all.

Continue reading