Upside Breakout Chart Pattern Rectangle
This is the 53th Day course in a series of 60-Days called “Technical Analysis Training”
You will get daily one series of this Training after 8 o’clock night (Dinner Finished)
Follow MoneyMunch.com Technical Analysis Directory and Learn Basic Education of Technical Analysis on the Indian Stock Market (NSE/BSE)

Upside Breakout Chart Pattern
Implication
A Pennant (Bullish) is considered a bullish signal, indicating that the existing uptrend may proceed.
Description
A Pennant (Bullish) observe a steep, or almost straight rise in cost, and consists of two converging trendlines that form a narrow, narrowing flag shape. The Pennant shape usually seems as a horizontal shape, rather than one with a downtrend or uptrend.
Separate from its shape, the Pennant is equivalent in all areas to the Flag. The Pennant is also comparable to the Symmetrical Triangle or Wedge continuation patterns however; the Pennant is typically shorter in duration and flies horizontally.

Trading Considerations
Inbound Trend
The constant trend is an significant characteristic of the construction. A superficial inbound improvement may indicates a length of combination before the amount move recommended by the construction begins. Look for an inbound trend that is extensive than the duration of the structure. A ideal idea of finger is that the inbound trend should be at least 2 times the duration of the construction
Continue readingSELLER DAY: MCX Crude oil, Lead, Cardamom and Guar seed
Who want hug profit? Go and sell MCX Crude oil… Once it cross 6432 and open downward then sell it with targets: 6403-6391
Once it cross 130 level then sell it.. small traders for intraday targets: 129.5-129.3
Don’t forget to keep your eyes on opening bell… if up then leave it!
Sell MCX Cardamom @ opening bell without any worry.
Targets: 702-697 below
Sell MCX Guar seed @ from every corner.. Targets: 5932-5863
To become a subscriber, subscribe to our free newsletter services. Our service is free for all.
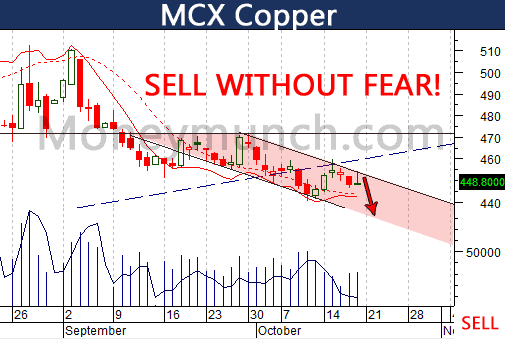
Commodity weekly free tips: MCX Gold, Silver, Lead, Crude oil, Cardamom & Guar seed
I don’t need to write something new here. You can check my 09 SEP article about Silver: https://moneymunch.com/weekly-outlook-of-mcx-gold-and-silver-cardamom-update/ There, I had written where silver will go!
For to know more about Silver, subscribe to our free newsletter services. Our service is free for all.
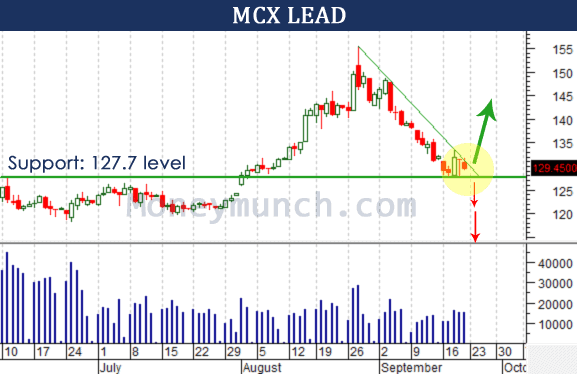
Look at above chart, you can see support 127.7. Once MCX lead cross and close below for 1-2 trading session means it will touch 126 – 124.2 – 122.5 – 120.5 levels non-stop. If lead not close below support means it will definitely kiss 134.6 – 139.2 – 140.6 – 143.8 levels without single one stop!
Now the choice is yours!
Exact direction with Stop loss for subscribers only!
Crude oil is at very crucial level. subscribers, are you ready for long-term position? Today, I will update for you only @ opening bell!
Cardamom is looking awfully downward. I feel we should sell it. Intraday Targets: 747-743 & Short term targets: 738-734 below
Yes, it stop loss is last week high for users. subscribers, you will get stop loss soon.
Guar seed is the best pick for this week. You can sell it with targets: 6466-6394. S/L is available for subscribers only!
New update: MCX Gold, Silver, Mentha oil and Cotton
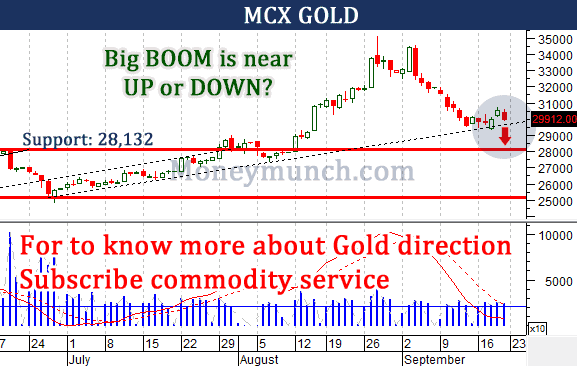
Respected Readers, do you remember date: Sep 09, 2013? I was updated about Gold & Silver – Long term direction?
Click here to read Sep 09 Newsletter: https://moneymunch.com/weekly-outlook-of-mcx-gold-and-silver-cardamom-update/
What I said, “New support 31,432 level. If close below my support then without any question, Gold will go down 31,226 – 31,122 – 30,916 below.

My Gold all targets completed in that week!

On SEP 09 newsletter, I had also written about Silver.
“MCX Silver is very clear. If it closes below 52,431 level then it will downside 50,356 – 48,621 – 46,885 – 45,509”

Yesterday, silver just missed few points to touch our second target. Now, I am expecting many more from MCX Silver. Big boom is near

Unlock This Article