The re-entry of China into the market thus you can say Gold prop come back! I was updated about Gold on 4 Feb, 2014 with short term tips. I had written, “Intermediate term traders for targets: 29970-30080” and MCX Gold was kissed my all targets in one trading session.
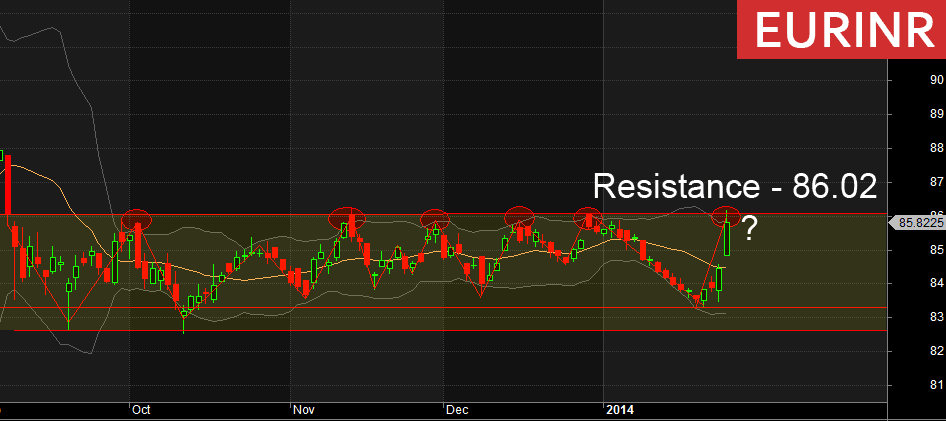
Today, what are you expecting about Gold? After re-entry of China, gold will move upside or downside?
You want to know where Gold will go then subscribe commodity tips now. members, please log in to view full Gold analysis with Chart:
 Unlock This Article
Lead is taking U-turn, if today it opens upside that mean you should buy it. Targets: 132.2-132.7
Remember, it should be open upside. If it opens downside then I’m sure, lead will try to kiss 131-130 again!
Want to make your intraday first trade safe? Then go with MCX Potato [Last close: 1120.9], targets: 1127-1131-1137
Opening bell is very important and stoploss for free users yesterday low!
To become a subscriber, subscribe to our free newsletter services. Our service is free for all.
 In financial markets, there are generally three types of traders available: the short term, the long term and the intermediate term. Gold has been in a downside for 2+ years now, the lowest investor looking sentiment in many years.
  MCX Aluminium closed at 103.9 and today once
  Copper was moved downside for a 10th day because of weakening demand after manufacturing slowed in China and the U.S. MCX Copper will take


 MCX Cardamom is very good item for intraday players. If open with green light, then follow me:
Targets: 763 – 766 – 770+
MCX Cardamom is very good item for intraday players. If open with green light, then follow me:
Targets: 763 – 766 – 770+