

Understanding the ABC Pattern and Retracement Levels
In the previous article, we learned about the most popular Fibonacci retracement levels:
- 23.6%
- 38.2%
- 50%
- 61.8%
- 78.6%
If you missed the previous article, make sure to read it first.
Today, we will learn how to use these retracement levels with the ABC pattern.
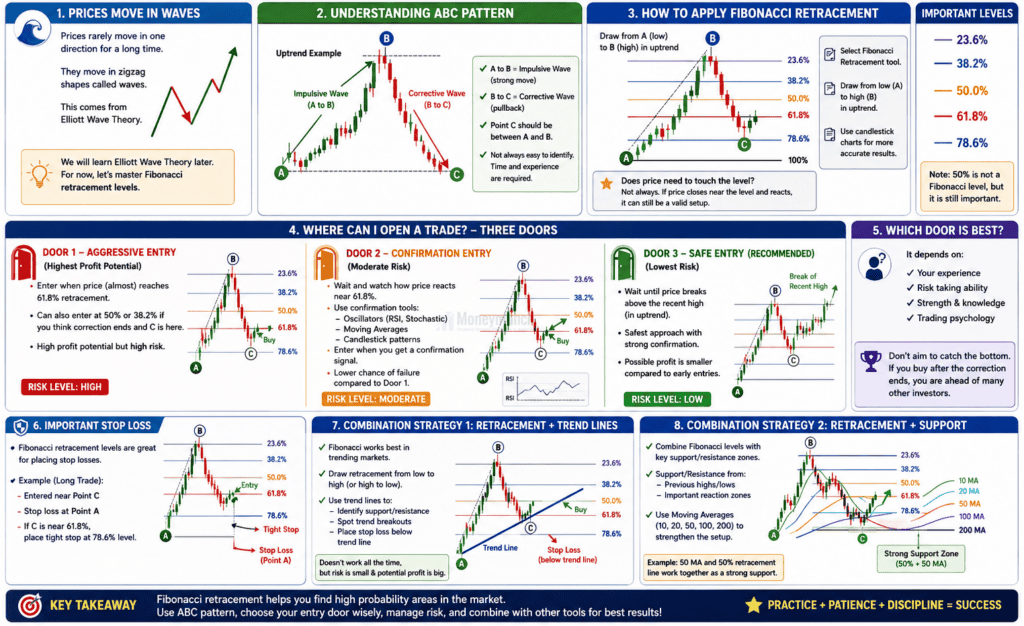
Why Prices Move in Waves
Prices rarely move in one direction for a long time. Sometimes, after major news or events, the market may suddenly skyrocket or crash, making trading difficult.
Most of the time, prices move in a zigzag pattern called waves. This idea comes from the Elliott Wave Theory.
We will study Elliott Wave Theory in a future tutorial. For now, our goal is to understand Fibonacci retracement levels in a simple way.
Understanding the ABC Pattern
First, you need to identify a market swing:
- A move from Point A to Point B is called the impulsive wave.
- A move from Point B to Point C is called the corrective wave.
Point C should stay between Point A and Point B.
It is not always easy to identify the ABC pattern correctly. It takes practice, patience, and experience.
How to Draw Fibonacci Retracement Levels
After finding the ABC move:
- Select the Fibonacci Retracement tool on your charting platform.
- Draw the tool from the low at Point A to the high at Point B in an uptrend.
- In a downtrend, draw it from the high to the low.
For more accurate results, use candlestick charts instead of line charts or area charts.
Should the Price Exactly Touch the Retracement Level?
Many beginners believe the price must perfectly touch the retracement level.
That is not always true.
Sometimes the price may reverse slightly above or below the level. If the market reacts near the retracement zone, the setup may still be valid.
Which Retracement Levels Are Important?
The standard retracement levels are:
- 23.6%
- 38.2%
- 50%
- 61.8%
- 78.6%
Note: The 50% level is not officially part of the Fibonacci sequence, but traders still consider it very important.
Where Should You Enter a Trade?
There are three common approaches.
Door 1 — Aggressive Entry (Highest Profit Potential)
You enter the trade when the price reaches a retracement level such as:
- 61.8%
- 50%
- 38.2%
You assume the correction is ending and Point C has formed.
This strategy offers high profit potential, but it also carries higher risk.
Door 2 — Confirmation Entry (Moderate Risk)
Instead of entering immediately, wait for confirmation.
For example:
- The price reacts near 61.8%
- An oscillator gives a signal
- Moving averages support the move
- A bullish or bearish candlestick appears
After confirmation, you can enter the trade.
This method reduces the chance of failure compared to Door 1.
Door 3 — Safe Entry (Recommended for Beginners)
Wait until the price breaks above the recent high in an uptrend, or below the recent low in a downtrend.
This is the safest approach because the trend confirmation is stronger.
However, the possible profit may be smaller compared to earlier entries.
Which Entry Method Is Best?
The answer depends on:
- Your experience
- Your risk-taking ability
- Your market knowledge
- Your trading psychology
Remember:
You do not need to catch the exact bottom or top to make money.
If you enter after the correction ends, you are already ahead of many traders and investors.
Stop Loss Using Fibonacci Retracement
Fibonacci retracement levels are also useful for placing stop losses.
For example:
- If you enter a long trade near Point C, Point A can act as your stop loss.
- If the entry is near the 61.8% retracement level, some traders may place a tighter stop near the 78.6% level.
Fibonacci levels can also help with trailing stop losses.
Combination Strategy 1: Fibonacci + Trend Lines
Fibonacci tools work especially well in trending markets.
You can combine Fibonacci retracement levels with trend lines to:
- Identify strong support and resistance
- Spot possible breakout areas
- Place stop losses below the trend line
No strategy works every time, but this combination often offers:
- Small potential risk
- Larger potential reward
Combination Strategy 2: Fibonacci + Support and Resistance
Another powerful method is combining Fibonacci retracement levels with important support and resistance zones.
These support or resistance areas may come from:
- Previous highs
- Previous lows
- Important market reaction zones
You can also strengthen this strategy using moving averages such as:
- 10 MA
- 20 MA
- 50 MA
- 100 MA
- 200 MA
Example
If the:
- 50 Moving Average, and
- 50% retracement level
are located near the same price area, that zone may become a strong support level.
Fibonacci retracement is not a magic system.
It is a tool that helps traders understand:
- Market corrections
- Trend continuation
- Support and resistance
- Risk management
The more you practice identifying ABC patterns and retracement zones, the better your understanding of market behaviour will become.
In the next article, we will explore Fibonacci projections.
Get free forex & commodity ideas, chart setups, and analysis for the upcoming session:
Want to get premium trading alerts on XAUUSD, EURUSD, AUDUSD, GBPUSD, etc., and unlimited access to Moneymunch? Join today and start potentially multiplying your net worth: Premium Forex Signals
Premium features: daily updates, full access to the Moneymunch #1 Rank List, Research Reports, Premium screens, and much more. You΄ll quickly identify which commodities to buy, which to sell, and target today΄s hottest industries.
Have you any questions/feedback about this article? Please leave your queries in the comment box for answers.

Ekbari padhlo fir image ko dekhna guys. Very simple to understand. Nice explanation mam!!!!