
Have you traded MCX Silver’s research report?
Click Here: Commodity Silver’s MOON to EARTH Journey May Start
MCX Silver : Tips & Update
 BEFORE
Commodity Silver’s MOON to EARTH Journey May Start

XAGUSD investors must fear to 18.305 level. At the current stage, it is strong support.
And if that happens with a breakout, be ready for the 17.00 and 16.00 levels because it’s a very crucial point for short-term investors.
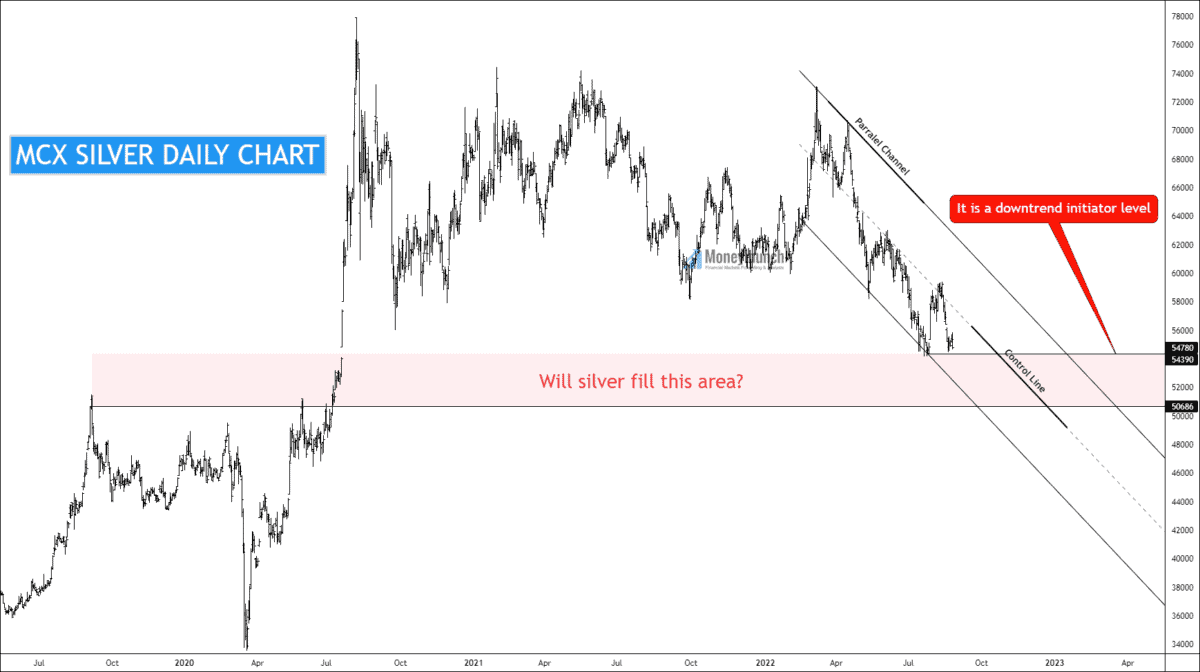
My point is to explain XAGUSD first because it closed at 18.902, and whenever it comes to hit the 18.305 level at that moment, the MCX silver will try to fill the following area (see the chart below).
Continue readingIs Silver(XAGUSD) Ready For Trend Change?
Silver(XAGUSD) has formed a downtrend channel for more than 48 weeks. Price has made a high of 30.03, and sellers entered the market.
Price Action Perspective:
Price has made a series of Lower Highs and Lower Lows, and the control line gives nine touches.
According to Dow theory, if the price breaks the previous LL, it will make a new LL. The upper band & lower band has provided strong reversals to the price.
After breaking the LL, if the price gives a breakout of the downtrend channel, it indicates the worst fundamentals. And if the price gets reversed to create the lower band of the downtrend channel, the price will march to the upper band touch.
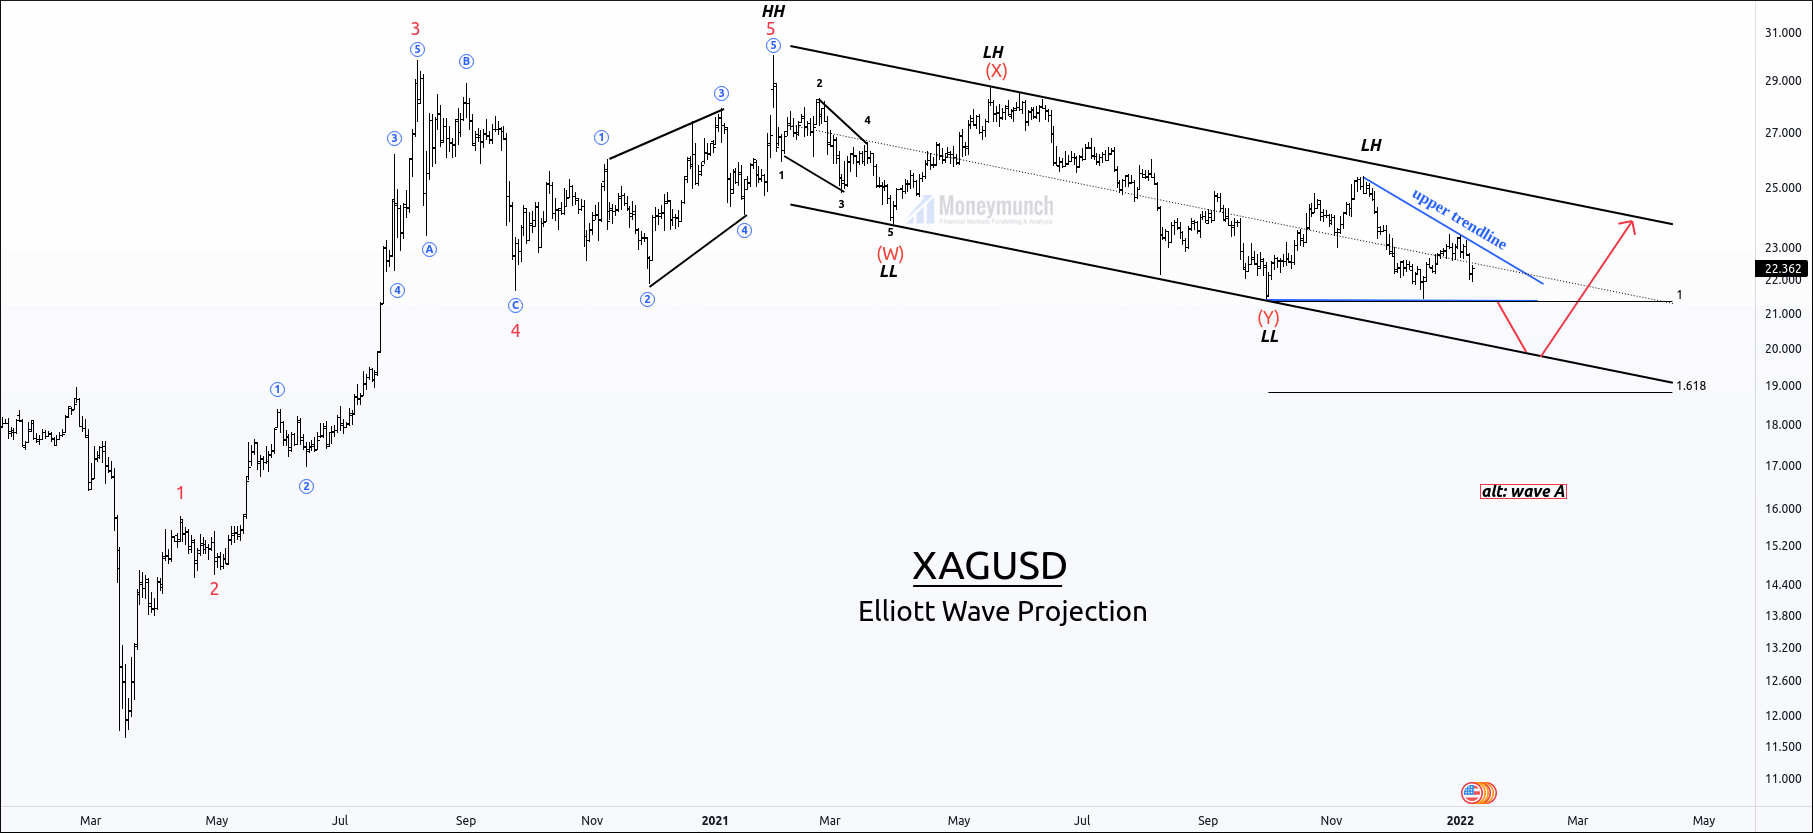
Elliott Perspective:
Price has constituted a corrective structure, where price has completed double zigzag(w-x-y).
It will create the last leg wave Z in order to complete the Triple correction. After making the last leg Z, silver will start a five-wave impulsive wave.
To become a subscriber, subscribe to our free newsletter services. Our service is free for all.
 Unlock This Article
Only subscribers can read the full article. Please login to read the entire article.
Continue reading
MCX Gold & Silver Spot Prepare For Another Price Advance
Determining the MCX Gold Price Next Big Move
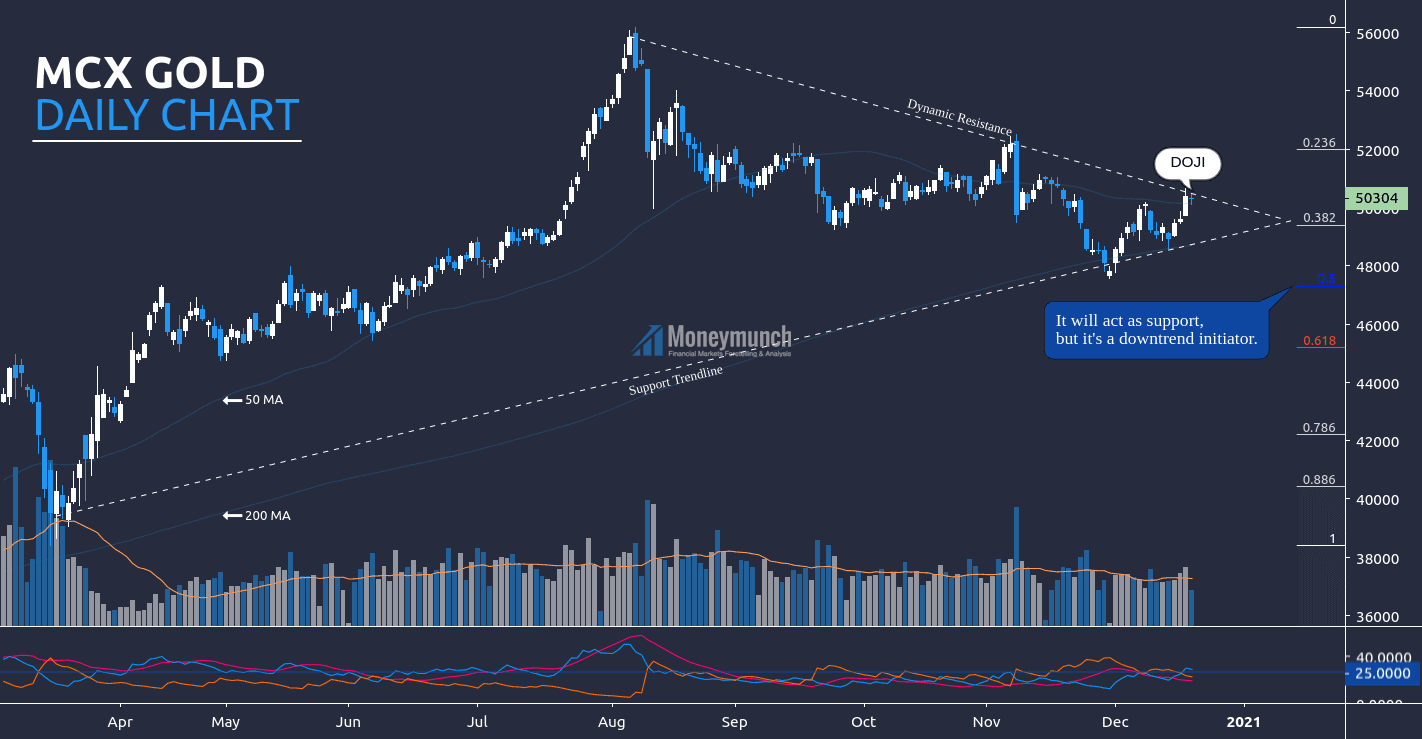
According to this chart, gold has started falling from August month. Doji appearing in the last trading session. It’s signaling a possible reversal. If gold follows the dynamic resistance, we may see a continuous downtrend. That can be up to 0.5 (47300) to 0.618 (45200) of Fib retracement.
Fib retracement (reverse):
Swing High: 56191
Swing Low: 38400
Here’s ADX less than 25, and +DI is above the -DI . Additionally, 200 MA & 50 MA is throwing uptrend signals. If we follow the moving average, gold may try to hit 51000 – 51990 (0.236) levels.
Intraday traders should watch dynamic resistance before entering.
Silver Follow Up & Future Predictions For 2020 & 2021 – Part I
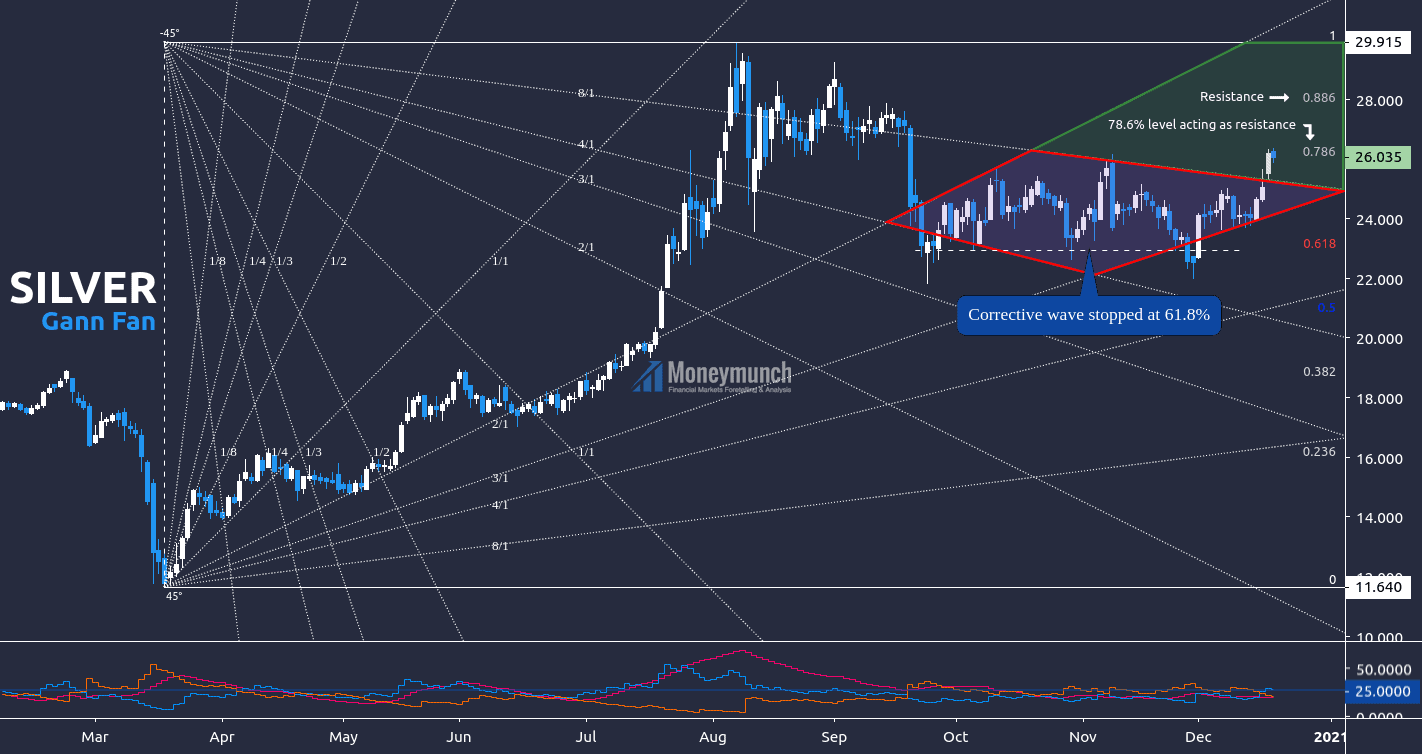
Here I have used Gann fan and Fibonacci on Silver sport to identify the current trend.
Fib Retracement:
Top: $29.90
Bottom: $11.64
If silver remains above the 78.6% level, the target will be $27 – $27.8
And if it goes inside 8/1 or remains below 78.6% level, we will see the silver price at 0.618 value of fib retracement. The day traders can use the following levels as targets: $25 – $24 – $23
According to DMI, ADX is less than 25 but turning up. And +DI is signaling an upside rally. Technically, silver is a further advance.
For advance traders, watch significant releases or events that may affect the movement of gold , silver & crude oil:
Monday, Dec 21, 2020:
- 12:00 – Gold Index
Wednesday, Dec 23, 2020:
- 3:00 – API Weekly Crude Oil Stock
- 21:00 – Crude Oil Inventories, EIA Refinery Crude Runs (WoW), Crude Oil Imports, and Cushing Crude Oil Inventories
- 21:30 – Natural Gas Storage
To become a subscriber, subscribe to our free newsletter services. Our service is free for all.
Continue reading
COMEX Gold & Silver Forecasts– It’s time to earn!

Day traders must wait for 1319 levels. Aggressive traders go and sell gold now because it’s going to touch 1314.1-1311.1 below levels.
Keep your stop loss 1322.1 levels. If Gold closes above the level, then you may see unstoppable up moves.
Trade in silver with perfect levels or do not trade. DON’T SELL THE SILVER UNTIL BREAK YESTERDAY LOW (19.456). Because if it will break out the yesterday low, then we may see 19.245 level in just a few hours.
To become a subscriber, subscribe to our free newsletter services. Our service is free for all.

Continue reading