To become a subscriber, subscribe to our free newsletter services. Our service is free for all.
Continue reading
Looking for reliable and free forex trading tips? Look no further than Moneymunch! We provide intraday and positional signals, technical analysis, research reports, and daily or weekly charts on major forex pairs, commodities, and cryptocurrencies to help you make informed trading decisions in the forex market. Subscribe now and stay ahead of the game!
“NEVER BEFORE HAVE YOU HAVE SEEN THIS PERFECTION OF CHART ANALYSIS“
As expected, Dow Jones and S&P 500 have been started to fall down. Let’s start by looking Nifty future…, Yes we are waiting for long “Expected time is 2-3day for long” Click here.
Yes, You can short-sell Nifty for 5928-5947 small points.
To become a subscriber, subscribe to our free newsletter services. Our service is free for all.
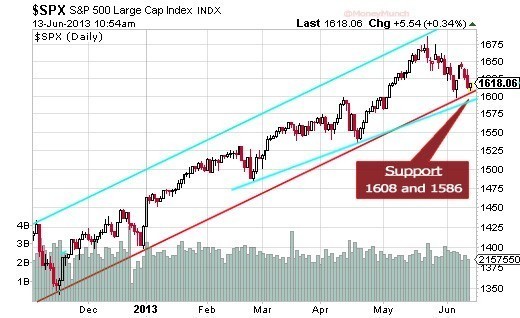
My short-term scenario has proven to be wishful thinking. I was looking for a potential Zigzag down instead the bulls have once again aborted a pullback that in my opinion has been delayed but not removed from a pending outcome.
Regarding the long-term count, I maintain the scenario of a potential Ending Diagonal. If it pan out it will complete the Double Zigzag wave (X) off the March 2009 low establishing a major top.
But instead of an expecting a larger subdivision of the wave (III) maybe price is approaching the end of this wave. If this is the case then once the wave (III) is in place in the next down leg, in order to be considered the wave (IV) of the Ending Diagonal, it will have to overlap below the peak of the wave (I). The potential target for the wave (IV) could locate in the range 1463.76 – 1435.50.In addition, if the Dow is unfolding the same ending pattern, then the wave (III) cannot exceed above 14089.64 therefore there is not much more upside left in order to maintain valid this option.
To become a subscriber, subscribe to our free newsletter services. Our service is free for all.Japan is following in the footsteps of the man who laid the groundwork for the greatest global inflationary operation of the modern era. We see the Yen in the top panel of the chart below forming a similar pattern to that which USD made from 2000 to 2002 as an epic bubble in credit expansion was being fomented in the US.
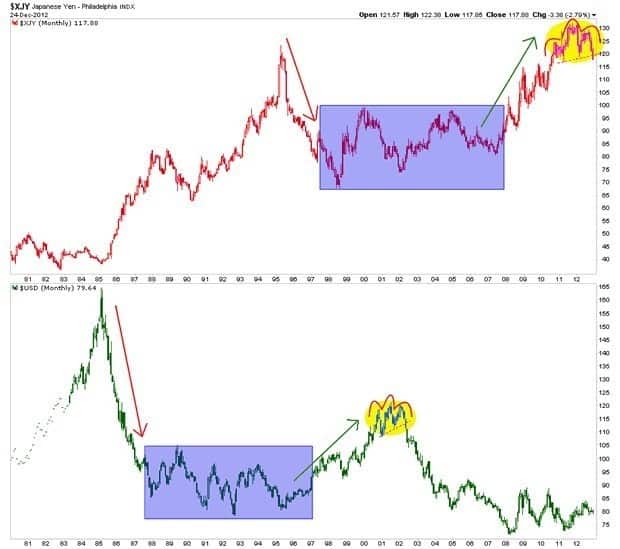
The similarity in the charts (with a decade stagger) is striking and it is probably no coincidence that Japan has chosen to leverage its currency – which had been chronically strong since the 2007 beginnings of the US-triggered global financial meltdown – just as the US did with the once strong ‘King’ dollar in and around 2001.
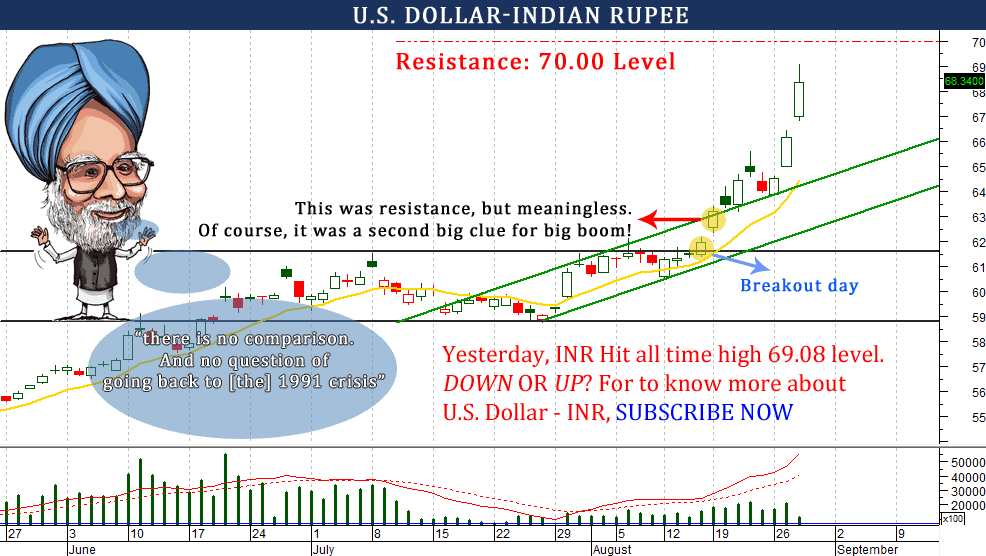
Challenging the strong resistance at
111.44/111.60.
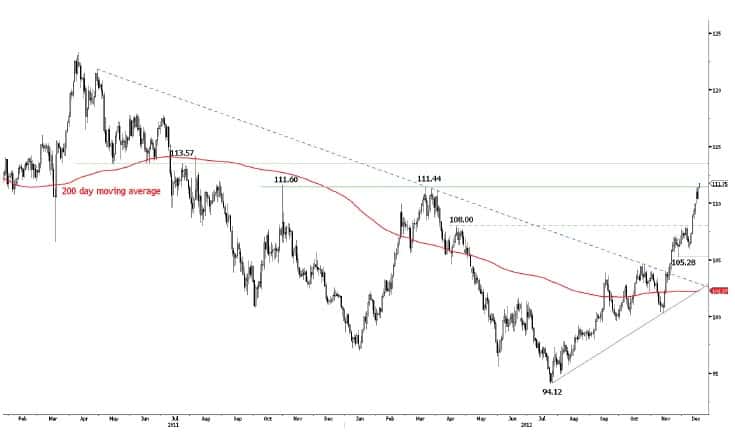
• EUR/JPY’s rise is overextended but, yesterday,
it managed to make new highs. It is now
challenging the strong resistance at
111.44/111.60. Given the general overbought
conditions, we favour a phase of weakness in the
next few days.
• EUR/JPY has moved above its long-term
downtrend (linking the October 2009 top with
the April 2011 top). Monitor the test of the key
resistance at 111.60 (31/10/2011 high).
Short 3 at 111.30, Objs: 110.35/108.10/106.10, Stop: 112.25