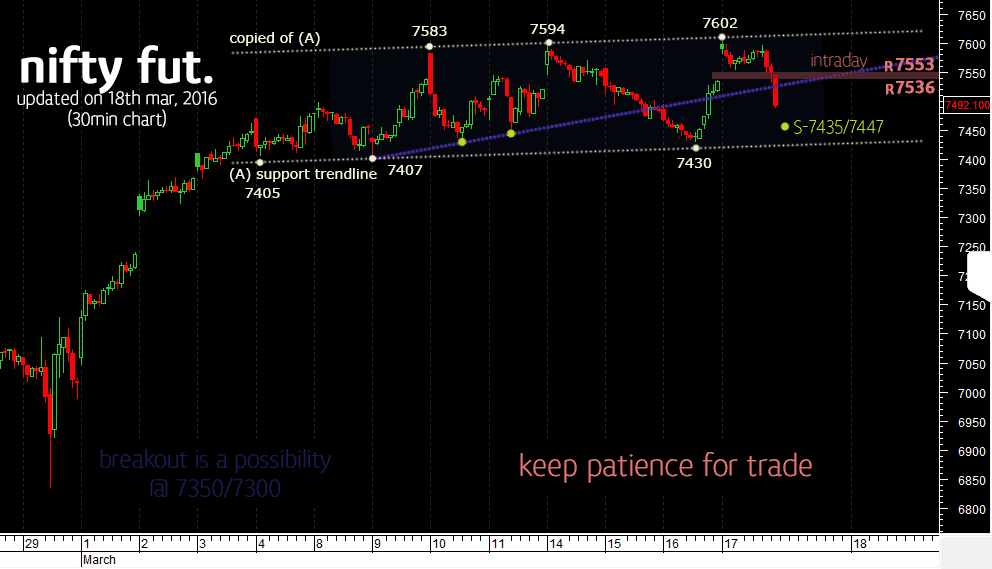
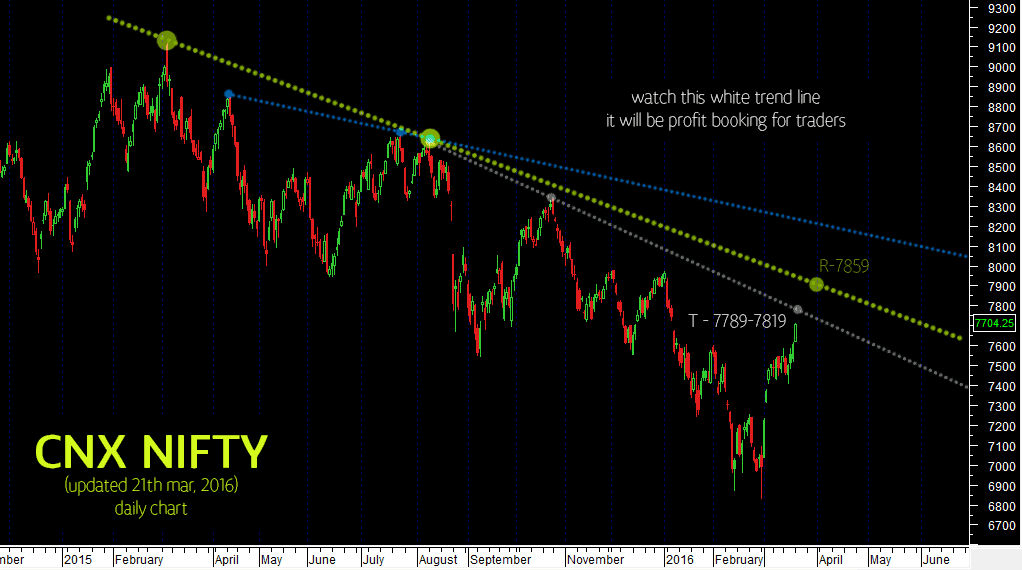
Niftybank: till bullish?

nifty-bank

Bank nifty is trading at 1524, but this index is look till upside 1568 until chart mentioned resistance. Need patience for short traders.

To become a subscriber, subscribe to our free newsletter services. Our service is free for all.

Continue reading

Nifty bulls is over! (Chart analyzed)

What if I told you that there was target 6832 on February 23, 2016, I was unable to update the next move about upward. In case, I would update, then we can easily predict this bounce in markets. Would you believe me? If your answer is yes, then you guessed right that our targets will be 7233.
it is my expectation that the first part of the month will play into this superstitious claptrap. However, once an expected higher low is in place, then a big move to the upside will be witnessed that sees March end impressively in the green.

Check here past research on nifty chart.

nifty-bulls-is-over
What is next?
We’ve seen, 7235 high of yesterday trading. If bulls are not over and close above 7250 or trade 7280 above! Then we can see next targets 7365 and very soon 7463.

To become a subscriber, subscribe to our free newsletter services. Our service is free for all.

Continue reading

TATAELXSI : time to watch this stock.

TATAELXSI

As per chart view, traders already entered into TATAELXSI, why so we can take entry if this stock drop with few points only.

Start focusing with your both eye on this stock.

To become a subscriber, subscribe to our free newsletter services. Our service is free for all.

Continue reading

Expect Nifty 50 continue fall if intraday level triggered

nifty-50

In the last update was 17th Feb, 2016, Nifty followed acculturated our level and chart path. It started to fall from high of previous of yesterday as 7252.

CLICK HERE PAST RESEARCHED ON NIFTY

We clearly mentioned 7248 to 7271 will change the direction of market.
Just compare last researched chart and present.

What is next?
7169 to 7144 is resistance for intraday only if trend is really bearish, then Nifty will close 7095 below. We can see fall of 6832-6798 very soon…!

Just look up S&P 500 chart and next level…

s&p 500

The chart below shows that the SPX 1650 level +/- may be next, and sooner than most think. Looking at this 2 hour chart of the SPX, we can see a similarity to the December 27, 2015 top. The move up from February 19 into February 22 is stronger by 27.7% suggesting a harder move down this time than in late December into January 20th.

To become a subscriber, subscribe to our free newsletter services. Our service is free for all.

Continue reading

Reference of yesterday call : Drready

drready-call

This chart for profiting booking level of yesterday’s call. But Drready is trading at, 3097. Let’s enjoy of this call…!

Note: This call sent to subscribers only by yahoo messenger!.

Click here for Nifty chart and Drready level of call …

To become a subscriber, subscribe to our free newsletter services. Our service is free for all.

Continue reading

Nifty, Crude oil, S&P 500 and more

expected-scenario-for-nifty

This chart help to find out level to trade… This is trade range for nifty…!

sp500S&P500 is bullish on short-term charts after quite strong buying since Friday currently that has a shape that is impulsive. We see a five wave move unfolding that is expected to carry on towards 1900 objective soon. Ideally, support is supposed to be today that is uncover 1860-1870 for revolution four. Invalidation level reaches 1833; for as long this holds momentum is on bullish part.

crude-oil

In the intraday chart of Crude oil, present price movement made a great reversal towards our help level at 29.00, and therefore the very first bullish leg from 26.07 low is completed. Having said that decline that is current to be black wave A, initial leg of a three wave modification, that may preferably achieve amounts around 28.45-29 area, where fib. Ratios could cause a bounce.

To become a subscriber, subscribe to our free newsletter services. Our service is free for all.


Continue reading