Improve your crude oil trading game with expert tips and insights from Moneymunch. Our free tips are tailored for Indian MCX and COMEX markets to help you make informed decisions.
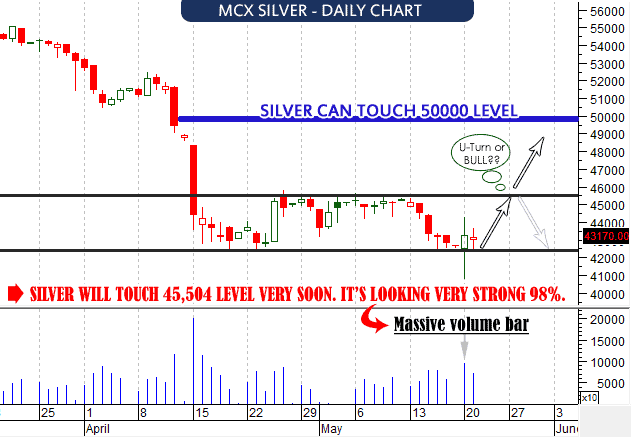
The daily charts of both gold and silver are beginning to show some bullish signs. On Sunday night, silver plunged about two dollar an ounce, but there wasn’t much volume, which is bullish huh. And on Monday, silver move like “Skyrocket” because action is not taken to reduce government debt. Oh yes, Monday’s trading volume was truly massive and there is now a “key reversal” day visible on the silver chart. See below MCX Silver chart.
You can see on above chart, silver is looking bullish for one-two weeks. If silver cross and close above 45,504 level then it will kiss 50000 level in few trading session. Let’s talk about this week, silver is looking strong and will kiss step by step 43751-44337-44997-45504. Where should I take position on silver? Sorry, I will say to subscribers with stoploss.
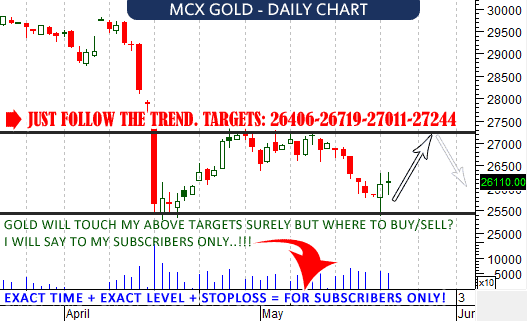
See above the gold chart and it is beginning to display a bullish hook. As I mentioned on above chart, just follow the trend. More information about Gold for subscribers.
For smart traders beck is enough: since late 2012 the S&P 500 has been on a nonstop rise, while gold has gone the other way…
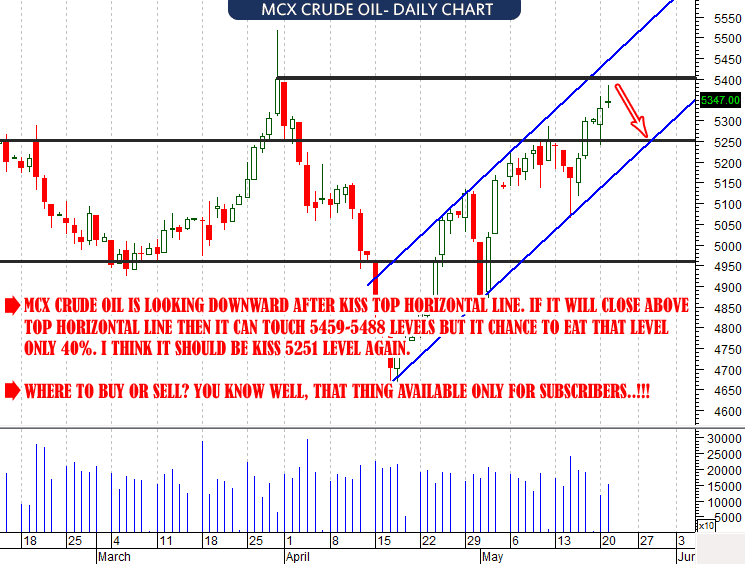
See below MCX Crude oil chart and get the future!
To become a subscriber, subscribe to our free newsletter services. Our service is free for all.
Yesterday I had written about Silver, Cardamom and Potato. Click here to read it. I was updated silver and cardamom targets done. But yes, yesterday Potato also hit my two targets. What else you need huh?
I hope, everyone enjoyed my all calls.
Today I am going to write about Silver, Crude oil and Mentha oil. To become a subscriber, subscribe to our free newsletter services. Our service is free for all.
Unlock This Article
Only subscribers can read the full article. Please login to read the entire article.
Today I’m expecting that day traders should have to go with Crude oil flow. It’s looking upward.You just need to care about opening bell. Once it open upward then go and buy it for intraday trading with targets: 5131-5143-5156. Remember, crude oil can take U-Turn from second target because it’s hurdle for you! Once MCX Crude oil go below 5107 then you will see seller pressure that’s why safe trader can place stoploss there. And also you can sell on that level with targets: 5092-5082-5073.
Did you see natural gas chart? Click here to see it. I was updated on 20 Mar. As I said to subscribers, natural is moving between top two bold line. Anyway, I will not discuss here about Natural long term view and trend because it’s for subscribers only. If you want to earn today, I just say one word. Sell it! If you will get any trouble then you can also place 216 level as stoploss. Targets: 212.2-211.3
Let me introduce favorite commodity. It is MCX Mentha oil. I don’t want to explain more about it. Just wanna say you, Go and Sell it. Targets: 1114 below. Free users for S/L last high!
To become a subscriber, subscribe to our free newsletter services. Our service is free for all.
niLet’s we start with our last newsletter. Our last newsletter published on 05/03/2013 at 9:30AM. If you forget then I should to remind you again. Click here to read it. Means two days back I said about Lead, Cardamom and Nickel.
On lead, I said,”Lead is moving downside day by day. Once open downward then sell it with targets: 121.7-121.1.” But lead was opened upside and continuously moved downward after opening bell..that’s why I said to my subscribers sell it and see now…
It kissed all target in just 1 day. What you want more? As you know, cardamom was kissed all targets on same day…
Today I am going to write about: MCX Crude oil/Cardamom/NCDEX Soy oil
To become a subscriber, subscribe to our free newsletter services. Our service is free for all.
Unlock This Article
Only subscribers can read the full article. Please login to read the entire article.


 Unlock This Article