EURUSD INDEX

EURUSD index hourly chart indicating reversal trend, you will see EURUSD 1.11886 – 1.12301 levels soon.
If it crossover or close below 1.11398 level you will see EURUSD 1.10 level.
USDCHF INDEX
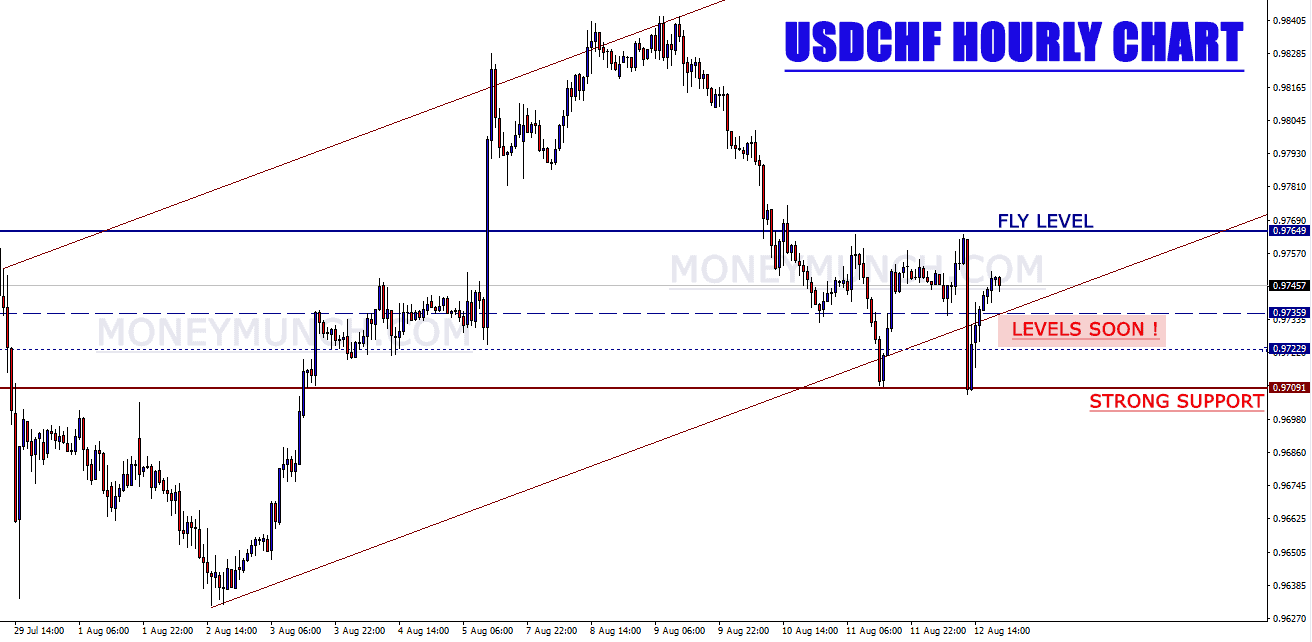
USDCHF is generating selling pressure. This selling pressure will push down the USDCHF up to 0.97359 – 0.97229 – 0.97091 levels. 0.97649 level will drag up so be careful with this level.
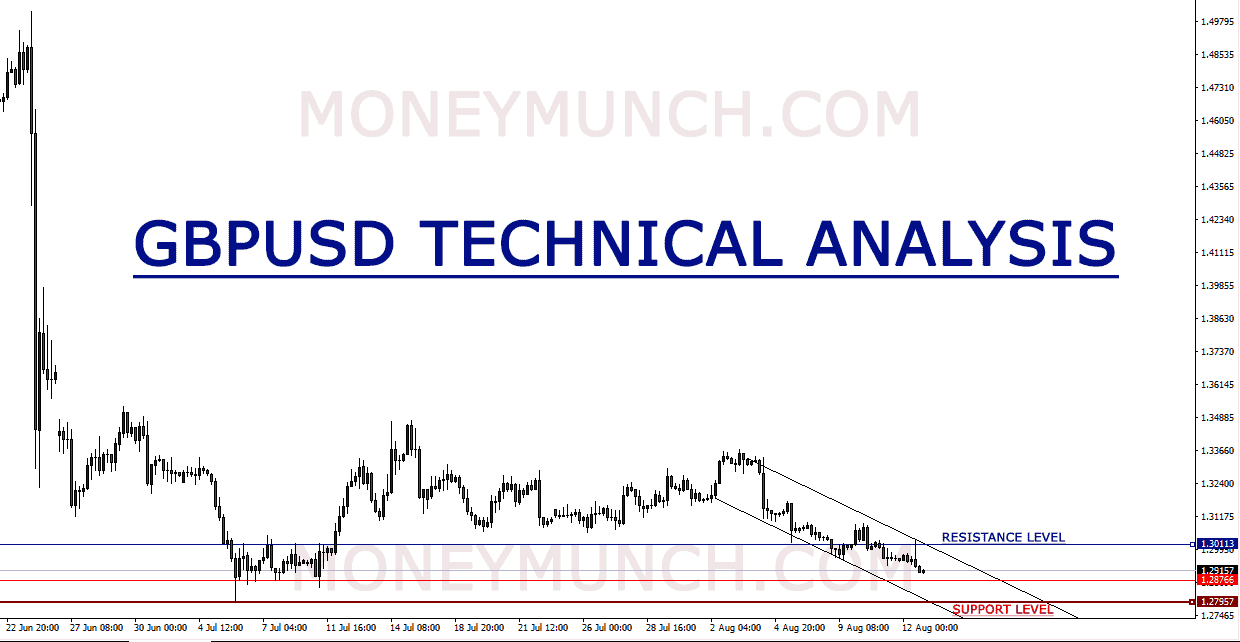
GBPUSD pair can come down up to 1.28766 – 1.27957 levels but don’t forget to keep eyes on event and this Tuesday event (U.K. Average Earnings Index +Bonus) is most important.
USDJPY CHART – Locked
 Unlock This Article
Only subscribers can read the full article. Please login to read the entire article.
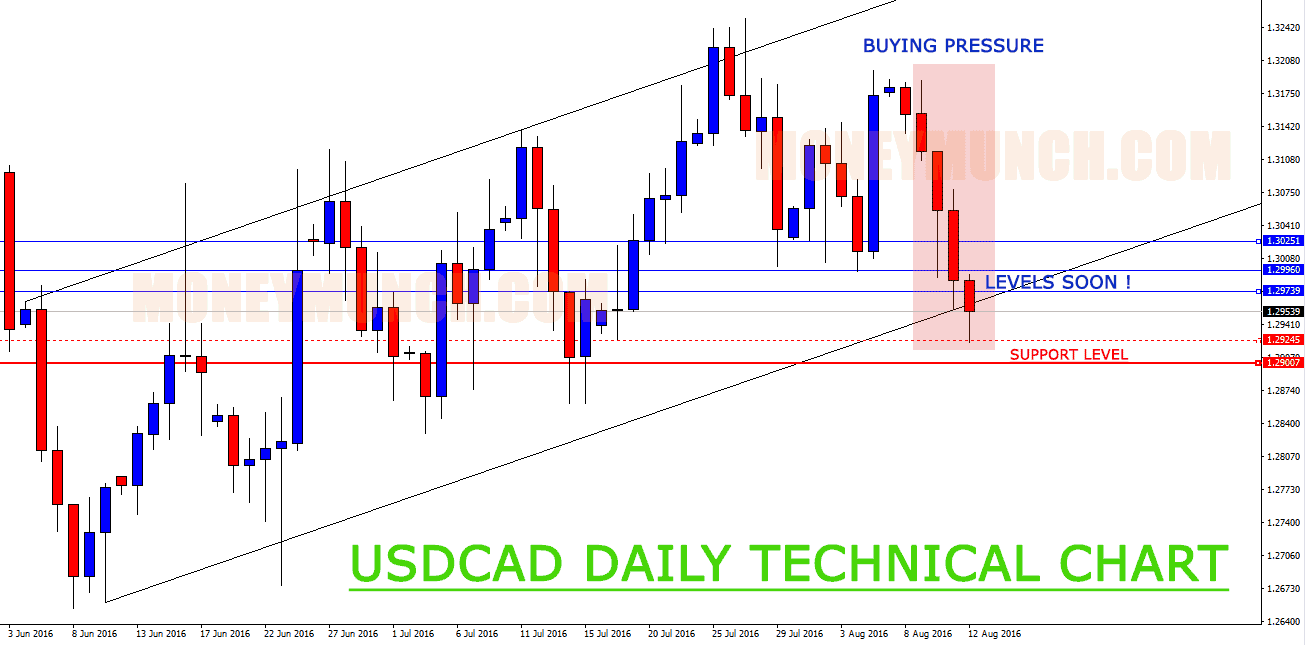
USDCAD generating aggressive buying pressure will see 1.29739 – 1.29960 – 1.30251 levels soon.
Keep in mind USDCAD close below 1.29539 level, it will touch 1.29007 level definitely.
AUDUSD Intraday Chart – Locked
Only subscribers can read the full article. Please login to read the entire article.
Continue reading