Benefits of Systematic Investment Plan (SIP)

“Disciplined investors built their own empire, others just made money”

systematic investment plans

Stock markets are for the rich, who can throw their money at anything and wait for a bigger fortune. This is the biggest myth I have ever heard, and also the most common myth among retail investors. In the hindsight, this is the only place where millionaires are made from nowhere. All you need to do is to follow few strategies and stick to a discipline. Among many investment strategies in the stock market, Systematic Investment Plan (SIP) stands out to be the least complicated one. Investing in SIP is like learning to swim. The earlier you invest, the greater your returns in the long run. There are two ways to invest in SIP. Either you choose a mutual fund available in the market or you can choose few stocks yourself and keep investing. It is like paying Pre-EMI. When you buy something and pay EMI, you are actually paying an interest to the bank, thereby increasing the cost of the product you bought. The bank decides the interest and the EMI. Longer the duration, higher is the interest. You cannot skip an EMI and have to pay it on the specified date.  If you wish to… close in-between, you will have to pay a penalty. The interest rate fluctuates depending on the market condition.

Continue reading

Commodity Gold, Silver, Crude oil, Nickel, Lead – Technical Analysis & Tips

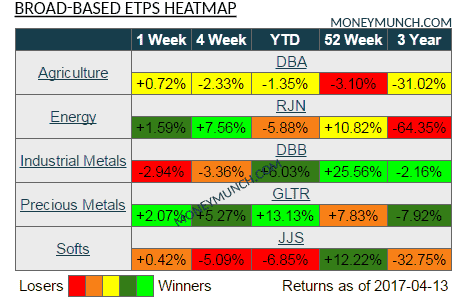
commodity broad-based etps heatmapIt’s very hard to decide which direction bullion commodities will go now because Shanghai-based bullion bank said, “If Trump is to perform some military action against North Korea, gold will definitely reach $1,300.” After Trump’s victory bullion commodities are going upside and metal commodities are going down. Look at the broad-based ETPs heatmap to understand last week games and that’s clearly indicating Precious Metals & Energy was positive and Industrial metals was weak.

Above COMEX market wrap-ups can help you to understand the MCX previous week movement. You may see last week Top Gainers & Top Losers below to get how that impacted:

TOP GAINERS TOP LOSERS
Silver11922.88%Nickel-30.1-4.58%
Silver mini11832.86%Nickel mini-30-4.57%
Silver micro11782.85%Copper-9.85-2.62%
Gold7252.53%Copper mini-9.7-2.58%
Gold mini7082.47%RBDPMOLEIN-13-2.39%
Gold petal541.86%Aluminium-2.65-2.11%
Crude oil mini621.85%Alimini-2.6-2.07%
Crude oil611.82%Zinc-3.35-1.95%
Gold guinea3961.70%Zinc mini-3.35-1.95%
Cotton800.39%Cardamom-21.3-1.53%
Natural gas-2.9-1.38%
CPO-4.9-0.94%
Lead-0.45-0.31%
Lead mini-0.45-0.31%
Mentha oil-3-0.30%

Previous week MCX Top Three Gainers(in Mega) was Silver (2.88%), Gold (2.53%) & Crude oil (1.82%) and Top Three Losers(in Mega) was Nickel (-4.58%), Copper(-2.62%) & RBDPMOLEIN(-2.39%).

GOLD & SILVER – BEST FOR INTRADAY TRADING

Moneymunch received so many comments & emails about Gold & Silver next moves. As per reader request, I should say 29000 to 29800 levels range are a trap for short-term/long-term investors. You must keep playing intraday trading between this range. If gold will break this range then my email will come in your inbox.

But if we talk about Silver then I should say buy at/above 42700 level after closing, for 43000-43400 levels.

CLICK BELOW “READ MORE” BUTTON TO READ CONTINUE… MCX GOLD, SILVER, CRUDE OIL, NICKEL & LEAD TECHNICAL REPORT…

Continue reading

A big congratulations, If this email is in box with SOLID trade script but,

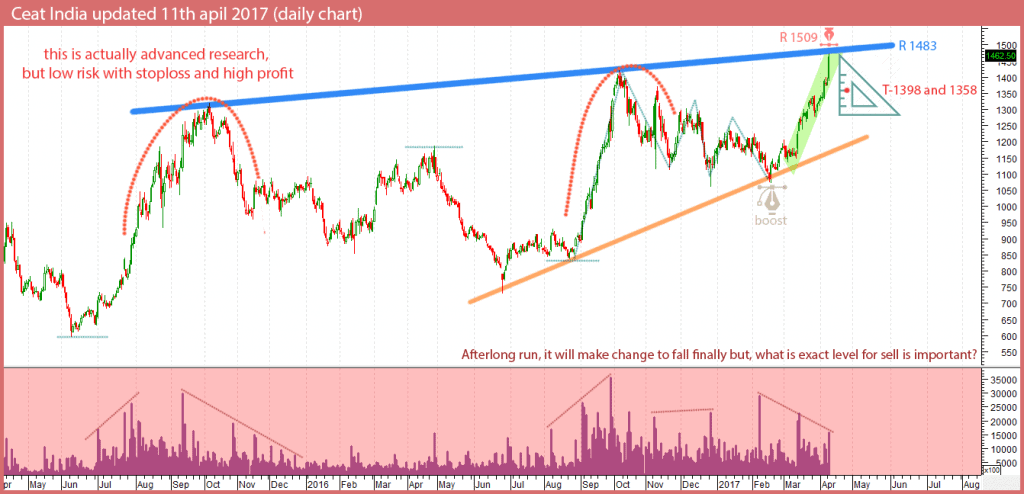
Like we’ve told you many times in the past, the biggest gains are sometimes made in the days, weeks, and months following our alerts. Now, You have on script is really great for you to sell in stock future but, you have right level for it… We have update NSE cash chart but, very soon or tomorrow you will get Future chart of CEAL India limited.

ceat-india

We’re waiting for tomorrow morning and will open this script in my dashboard with the chart… You too!

If time permit, I will update for you in FREE. To become a subscriber, subscribe to our free newsletter services. Our service is free for all.

Continue reading

Nifty future, is on the move yet again?

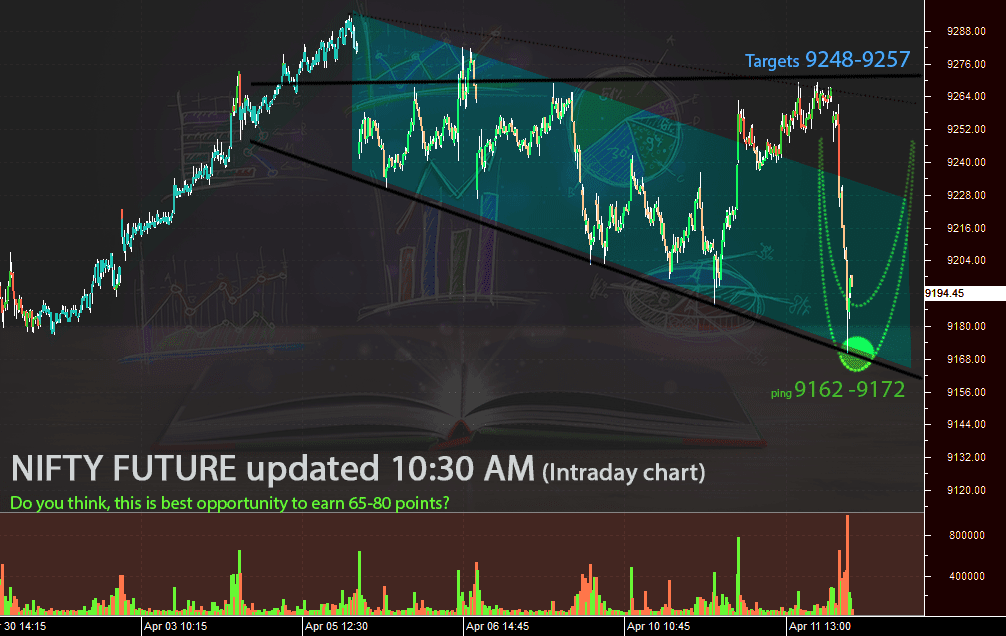
Traders who acted on last traded 9190 around perfectly-timed buy call, have now had the opportunity to cash as mentioned in chart at 9238-9247. Yes, You might see here again buyers come for targets 9289-9314 very soon. First of all, look at the chart closely.

nifty-future

Above 9170 is really long way of nifty future, if nifty sustain above it then possible to see 9368-82 but, ….!


NEW UDPATE For  Subscribers…! Updated on 12th April 2017 (Time: 10:10 AM)

Support for Nifty future live : 9162-9180 for targets 9245-9286

Tomorrow 5:30 PM IIP data for Feb 17 and CPI inflation for mar 17.

To become a subscriber, subscribe to our free newsletter services. Our service is free for all.

intraday-paid-client-chart-nifty-future
Continue reading

Metal commodities wrap-up, Crude oil & CPO – At Turning Points?

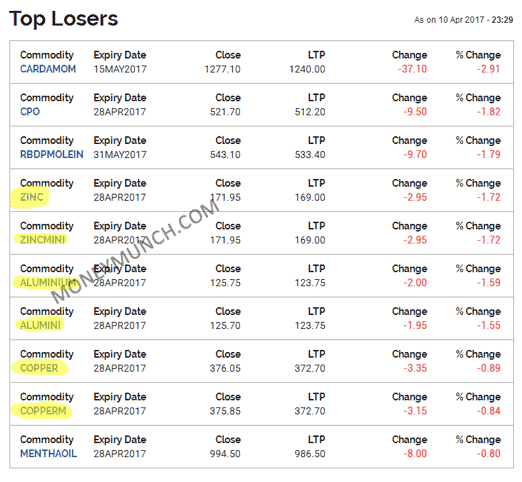
Yesterday metal sector was going down. Look at Top Losers chart, if you will excerpt Agri commodities then metal sector commodities can be in top 5 losers list. If you’re planning to sell today any metal, then wait… Today it’s recovery time! But if we look at zinc, I don’t think we should wait for more. Look at my MCX Zinc report by click here.

You can see in the chart, Zinc support is 171.4 level. Yesterday, it had closed at 168.40 (-2.06%). Do you think Zinc will touch 163.2 level before this weekend?

Subscribe to our service to read full report of zinc >>

mcx top losers tips

Crude oil is going to show the negative price in opening bell. It’s a big trap! You must keep your eyes on $52.90 level. If crude oil breaks this level, then we can see $52.60 today.

If it will remain above to $52.90 then nobody can stop the crude oil to touch $53.20 – $53.40 level.

crude oil intraday trading tips
Continue reading