How many of you traded on the Nifty call today?First, read the nifty call report: click here →
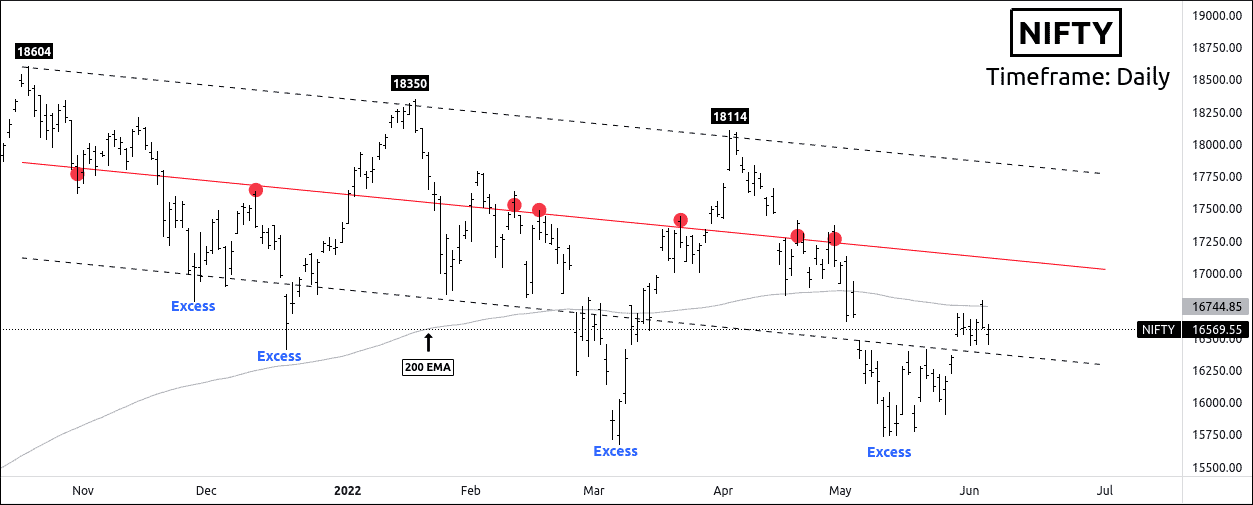
Today morning at 8:30 AM, I had written, “…that’s clear sign bulls are stepping in. If it remains above the support trendline on Monday, we can expect target levels of 16490 – 16580 – 16680. It could skyrocket up to 17000 level”.
Nifty had made a high of 16695.5 and achieved all targets.Continue reading
 Unlock This Article
 How many of you traded on the Nifty call today? First, read the nifty call report: click here →