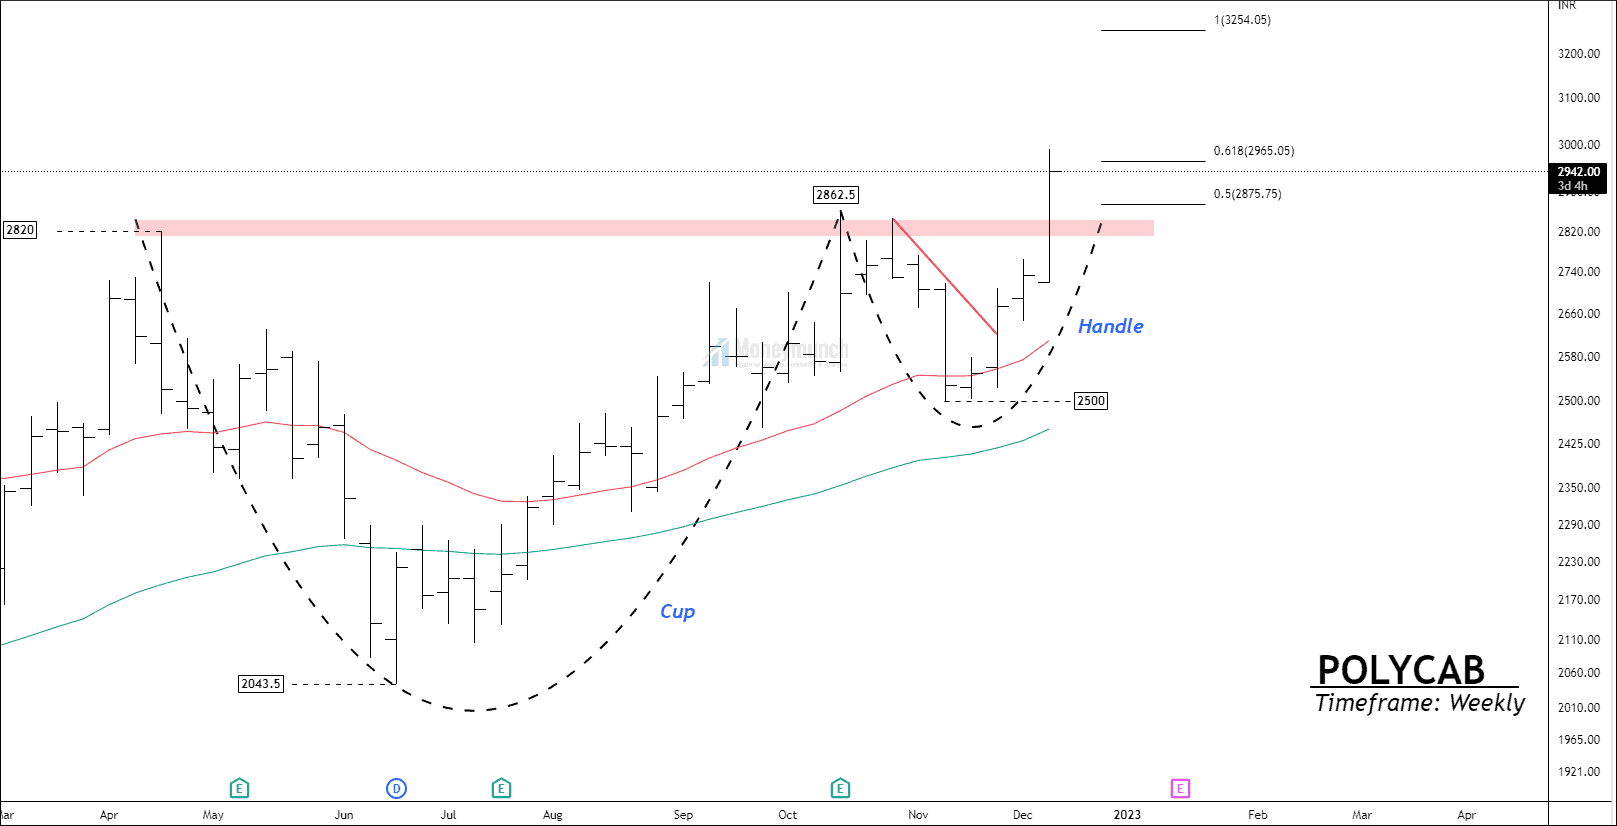
NSE TECHM – High Confidence Research Report

Free nse techm weekly chart calls

Timeframe: Weekly

TECHM has made a high of 1838 and completed the impulsive wave (5). It is the ending point of an impulsive wave that marks the beginning of a corrective wave. After the breakdown of the base channel, the price has stated an ABC correction.

TECHM has accomplished an impulsive wave at 943.7 with 2.618% reverse Fibonacci of wave (B) and 1.618% of wave (A). Wave (C) occurred nearby the previous sub-wave 4th at 943.

The current price movement is near the recent high of 1164, which represents a resistance level. This level should not be ignored if you have taken a long position. 1164 -1196 is a strong resistance zone that can abrupt upward momentum.

If the price breaks this range, swing/Positional traders can buy for the following targets: 1262 – 1360 – 1436+. Breaks out of the previous high suggest start of an impulsive wave, but the range breakout will be a strong evidence for an impulse. 

Free nse techm weekly head and shoulders callsContinue reading

3-Tricks : Where to start Elliott Wave counting on the chart?

Publish Date: 26/08/2021
UPDATE 2.0

how to wave count in elliott waves?

We get a lot of questions about Elliott Wave, but a set of questions often received from the followers:
  • Where to start wave counting on the chart?
  • How do I begin/start wave counting on the chart?
  • How do you do Wave Counting?
As a part of establishing Elliott Wave Counting on a chart, we use three working tricks. These are my steps/processes or tricks that can help you to start counting waves.Continue reading