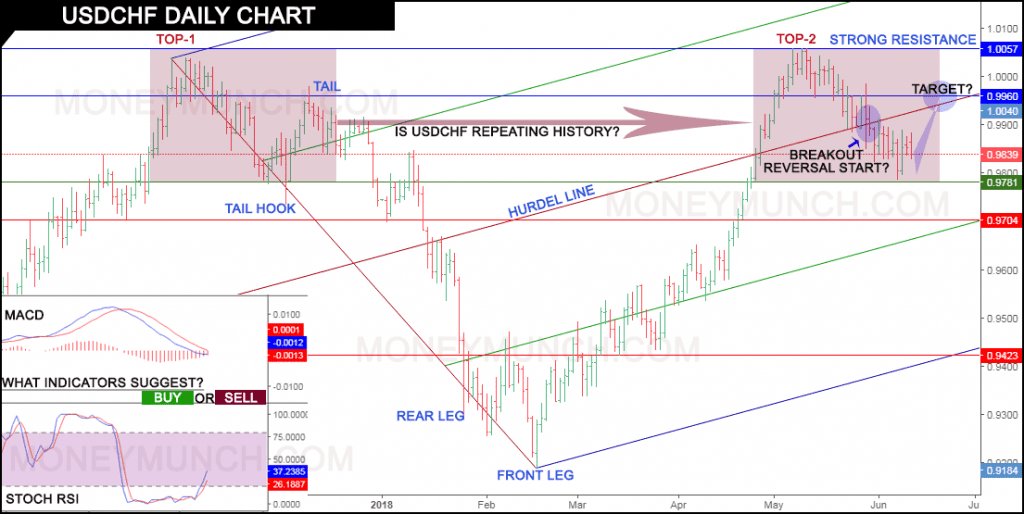
USDCHF chart analysis for smart traders, find your position in the chart and trade safe.
 Unlock This Article
Only subscribers can read the full article. Please login to read the entire article.


USDCHF chart analysis for smart traders, find your position in the chart and trade safe.

What had I said for USDINR index? Click here.
I had Strongly recommended,
We have already recommended waiting for the crossover levels.
Bullish side rally will initiate after the crossover of 67.186 level. It will over after breakout of the following target: 67.492 – 67.852 – 68.105 levels.
Solid Support: 66.818
To become a subscriber, subscribe to our free newsletter services. Our service is free for all.
Continue readingStrong Resistance: 79.0064
But don’t sell after the breakout of the resistance level. Why? Because of technical indicators are indicating a solid uptrend after this level breakout. It can be up to 80.1007 level.
*Events : India Nikkei Services Purchasing Managers Index (PMI)
We have already recommended waiting for the crossover levels.
Bullish side rally will initiate after the crossover of 67.186 level. It will over after breakout of the following target: 67.492 – 67.852 – 68.105 levels.
Solid Support: 66.818
Support breakout means downtrend up to 66.674 – 66.444 – 66.204 levels.

This pair price will drop in upcoming days. As per the technical analysis, it’s weakening.
Target: 88.927 – 88.361 – 88.046 level.
Stop Loss is available for subscribers. To become a subscriber, subscribe to our free newsletter services. Our service is free for all.
Strong Resistance: 79.0064
Selling pressure will increase soon. It’s very close to the resistance level. It can be dropped up to 77.8244 – 77.2010 – 76.6865 levels.
But don’t sell after the breakout of the resistance level. Why? Because of technical indicators are indicating a solid uptrend after this level breakout. It can be up to 80.1007 level.
*Events : India Nikkei Services Purchasing Managers Index (PMI) Continue reading
In the previous week it prices value increase 40.2 rupees. This commodity price is moving higher. In upcoming days, we will see Nickel price at 1042 – 1055+. Buy in deep for getting maximum profit.

Strong Resistance: 22600
Breakout and Closing above the resistance level indicate solid uptrend. A simple strategy for making a trade on Cotton: wait, watch and earn.
Target: 23000 – 23500
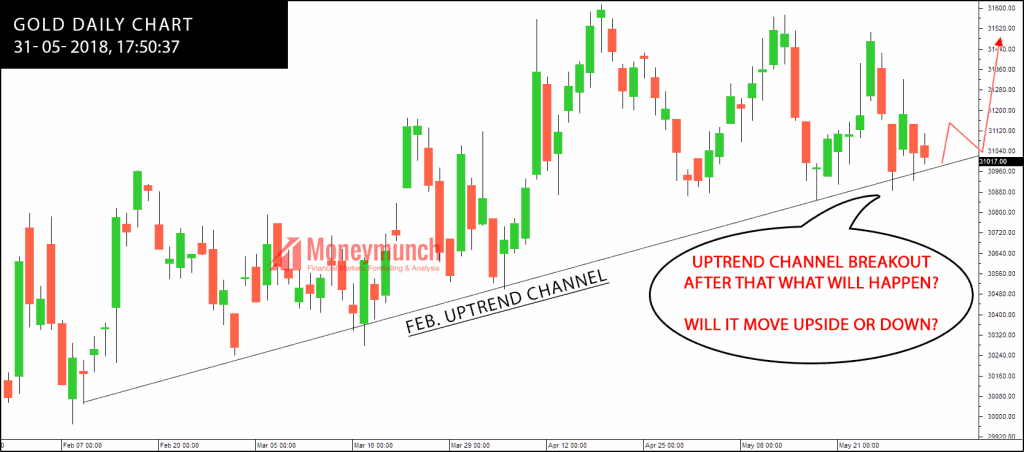
Test of downtrend resistance successful by hitting the support trendline channel. The technical structure suggests short-term downward moves but in the long-term, there is a growing upside momentum as per our previous research (click here).
Major support: 30900 level
Major support breakout can generate extreme selling pressure. The support breakout can come down the gold price up to 30700 – 30560. Don’t get confused by just breakout. It can be fake out also. To become a subscriber, subscribe to our free newsletter services. Our service is free for all.
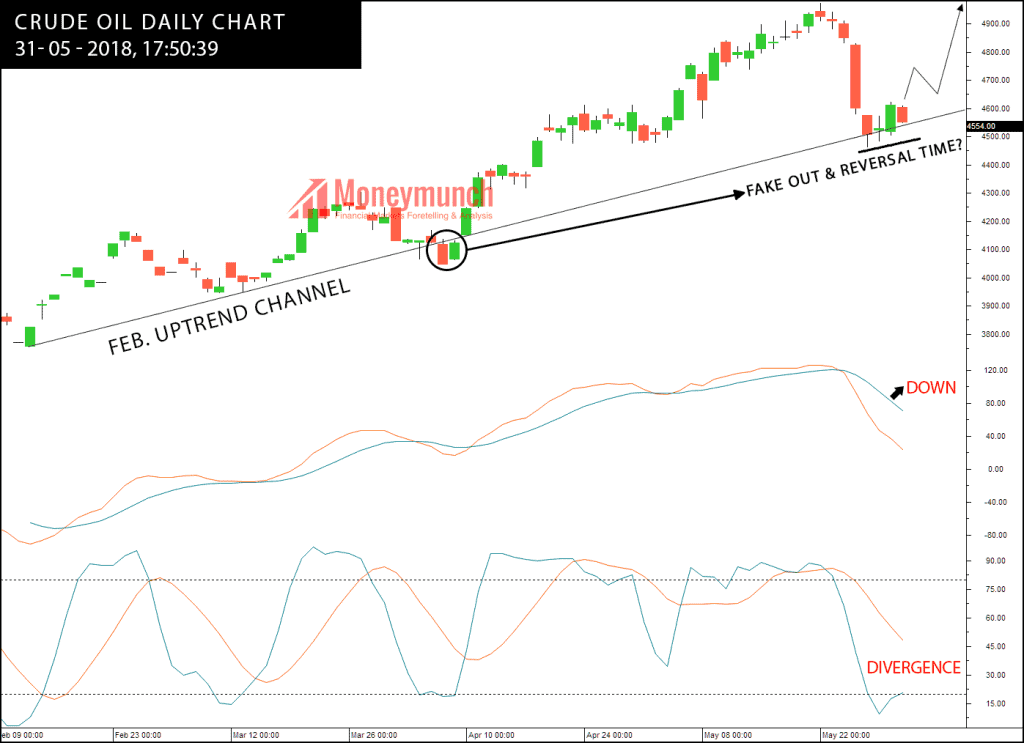
Everything depends upon the Feb month support trendline channel, look at the chart. In the longer term, the momentum is turning largely positive. We favor a continued bullish bias.
Reversal Target: 4700 – 4800 – 4900 – 5000
Downtrend Target: 4400 – 4300
Fake Out & Reversal Time will reveal soon. For the greedy trader and short-term investors for this is a perfect time. I will update that to members only.
 Silver can be buyable after two days closing above, 40840 level. It may show 41500 level.
Technical indicators and robot trading software are indicating bullish, but don’t get trapped. We will see a small reversal before uptrend start. The short-term investor should avoid trading in the silver stocks. It’s time for intraday trading.
Subscribe Now: Receive Silver Trading Alerts on Market Hours.
Note: For Gold & Crude oil trend my view is same as before. Click Here

Did you read previous report of lead? If not, click here.
“… But if it remains above to 161.5 then buy. Target: 164 – 167,” I had written.
It has been touched all target in the previous trading sessions.
In the last trading session, it dropped 5.15 rupees. What to do this week in lead?