What you think about Gold, Cardamom and Pepper?

Do you remember what I had written about Gold two times.. Click here to see it. I said, “Gold will touch 29456 – 29429 – 29360“. Yesterday Gold all targets blasted!
Today I’m bit worry about Gold because it closed at Hurdle 29264. It’ll take U-Turn or not from Hurdle?
To become a subscriber, subscribe to our free newsletter services. Our service is free for all.
Commodity newsletter: Gold, Crude oil, Nickel and Cardamom

What I had written on my last two newsletters? You don’t know then click here read last newsletter and for Nickel call Click Here.
Let’s start talk about Nickel first,
I said on 4th July 2012: Sell nickel without worry with targets: 932 – 930 – 928 and yep, our subscribers also sold it @ 939 and just today booked profit.

Oh yeah! I also said about Cardamom, I hope you read my last guesstimate carefully. I told you to buy cardamom when it was run around 1336-40 and yep that day it was kiss our cardamom all targets. Today also my subscribers bought cardamom at morning by sms, “BUY CARDAMOM @ 1454 AND BOOKED PROFIT 1482 LEVEL.”
I was also mentioned about Crude oil on 5th July but I said strictly to everyone – IF ONCE OPEN UPSIDE THEN DON’T SELL IT. I hope everyone listen carefully and leave to trade on it. Why I am saying here again because some peoples call me said to me, “I sell crude oil at opening bell.” Oops! When I was listening that time I got dizzy really.
That day also said same about Gold and yep.. I said my subscribers close eyes and sell it and forget! Also Gold was opened down side as I said and we sold it and still hold. I’m thinking it’ll crash more but I will update about Gold for my subscribers only! To become a subscriber, subscribe to our free newsletter services. Our service is free for all.
To become a subscriber, subscribe to our free newsletter services. Our service is free for all.!
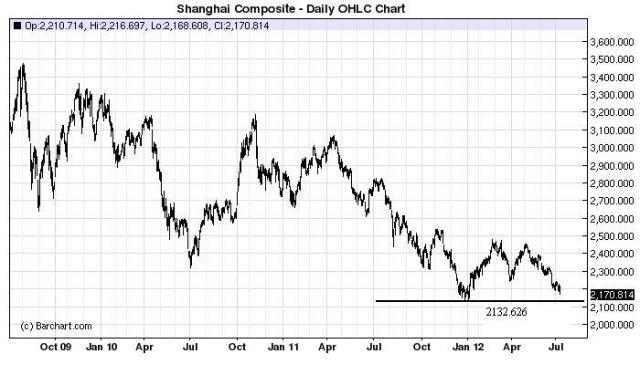
Shanghai Composite reached to Support

The Chinese government reported imports rose just 6.3 percent last month from a year earlier, less than half the 12.7 percent expected increase. No doubt this reflects softening domestic demand in the world’s second largest economy and one reason why commodities have been selling off.
Don’t you think the government has to be cooking up something big?
To become a subscriber, subscribe to our free newsletter services. Our service is free for all.
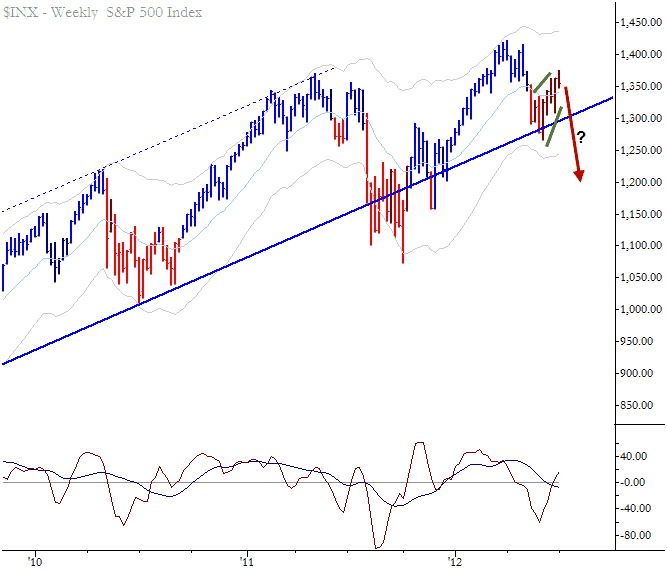
Weekly Market Structure in S&P 500
Note the weekly bear flag on the S&P 500 index. You may call it by a number of different names (wedge, pullback, anti, flag, etc.), but the concept is the same: A period of contracting volatility with an upward bias following a sharp selloff. This pattern could be expected to resolve downward, providing a headwind for bearish trades over the next several weeks. Be aware that weekly patterns can take a long time to play out, and there is plenty of room for upswings on daily and intraday timeframes even if this weekly pattern resolves cleanly. Knowledge of higher-timeframe technical patterns often provides good context for trades on lower timeframes. This is an important part of understanding evolving market structure and potential technical risk factors.
To become a subscriber, subscribe to our free newsletter services. Our service is free for all.
World Markets: Is the Stock Market Ready to Rally?
- The endless European debt crisis,
- Collapse of commodity prices (including crude oil),
- Middle-East instability (Iranian nuclear threat, Syrian civil war, religious radicalization of Egypt)
- Increased tax burden and job-killing effect of Obamacare
- U.S. presidential election and the impending “fiscal cliff” in 2013, promising automatic spending cuts and tax increases
- Record-low U.S Treasury bond yields and an 18-week low in the Economic Cycle Research Institute’s Weekly Leading Index may signal a new U.S. recession
- Chinese economic growth may be weak for “several years”
- U.S. employment report for June was weak
Continue readingBottom line: I’m feeling more bullish.


Unlock This Article