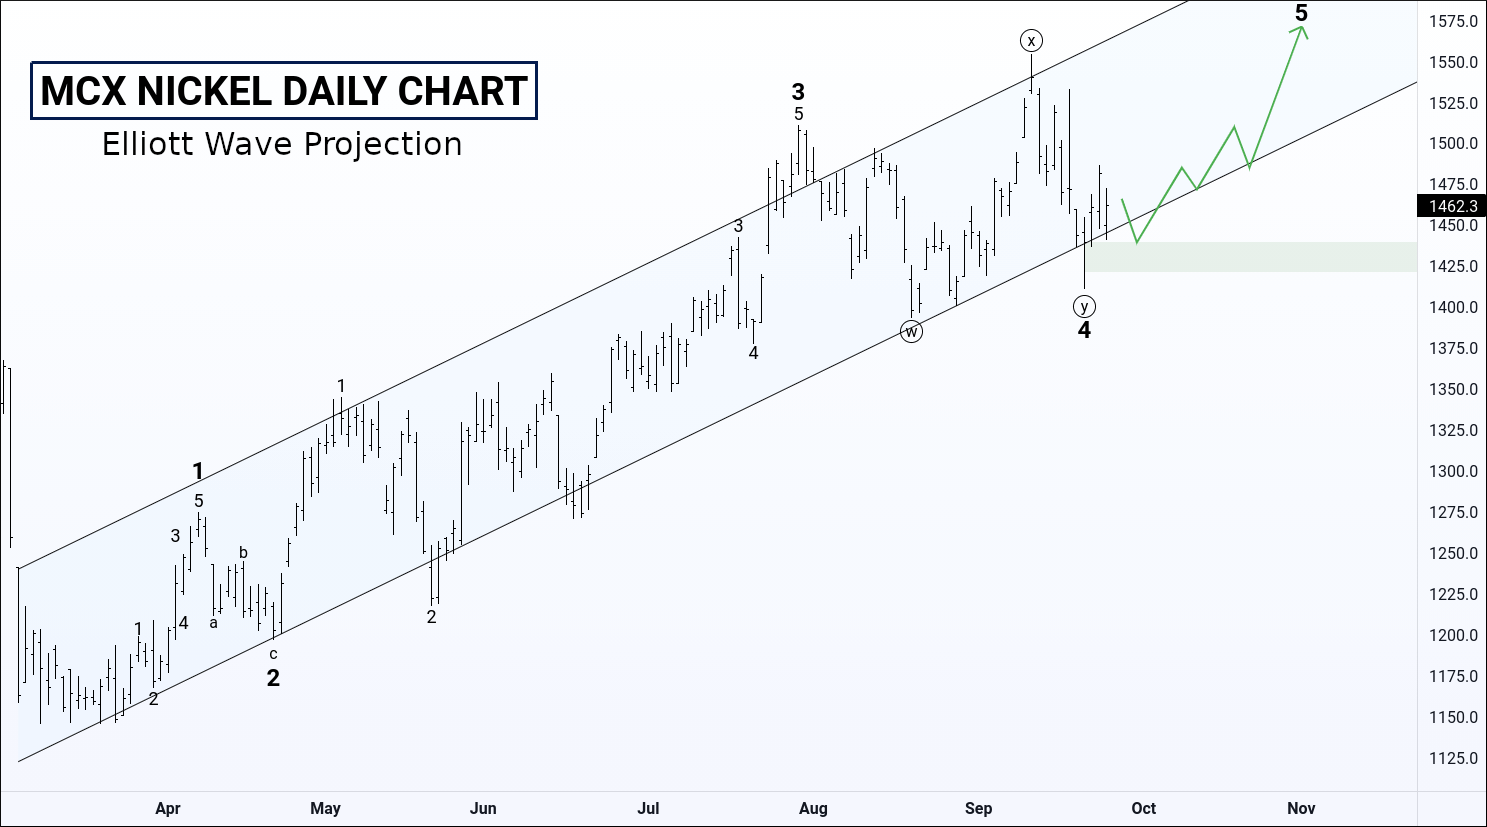
MCX nickel’s Elliott wave projection (Target 1570)
Nickel has started moving forward since March 2021. It will complete the 5th wave soon.
According to Elliott wave projection, MCX nickel can touch 1570 to end the 5th wave.
Intraday & short-term traders can buy nickel for the target of 1485.6 – 1506 – 1532 – 1550 – 1570.
To become a subscriber, subscribe to our free newsletter services. Our service is free for all.
 Unlock This Article
Only subscribers can read the full article. Please login to read the entire article.
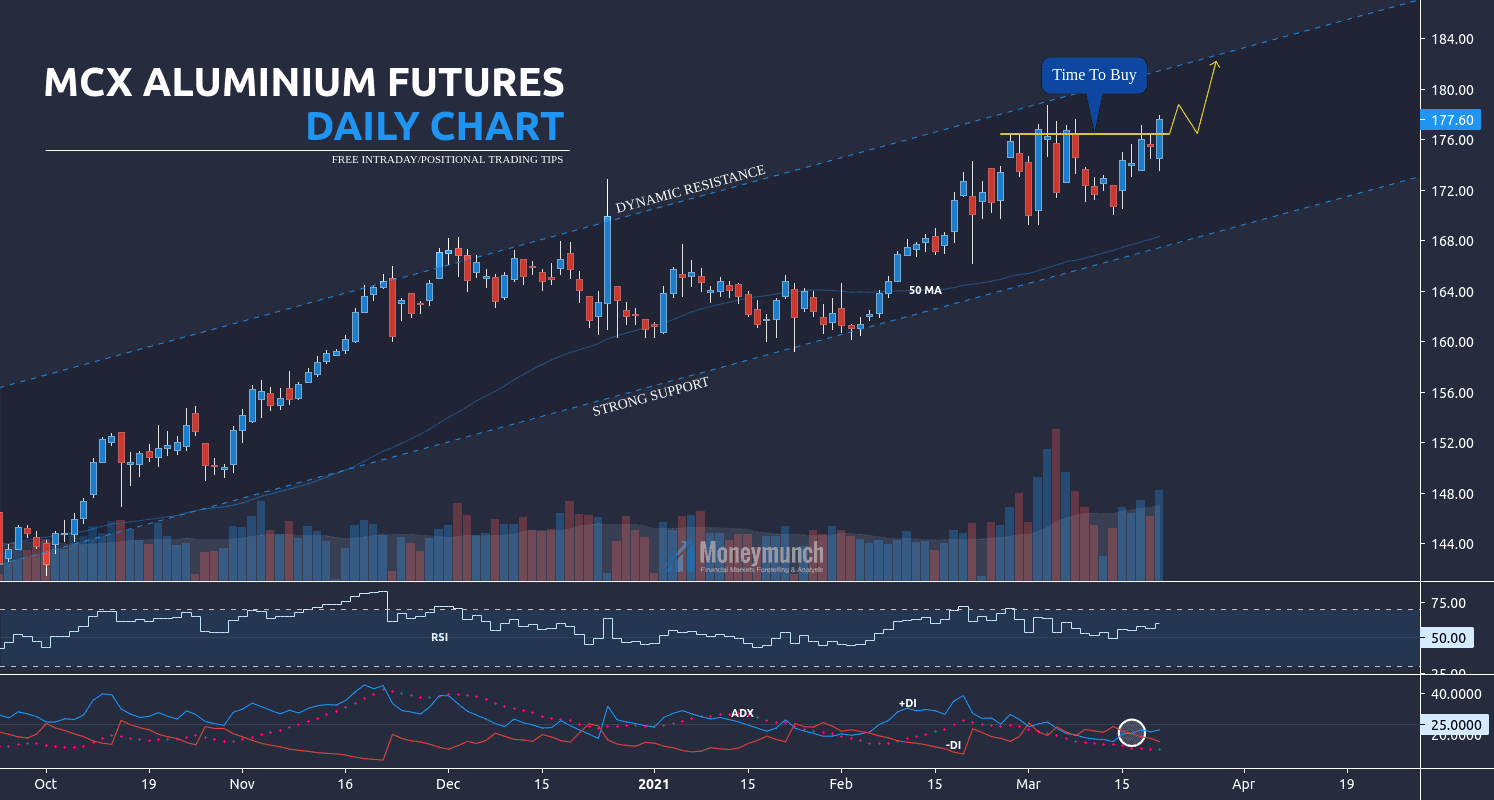
Aluminium Should Run Up To 240+ In Next 30 Days
Key levels: 229 – 226.8
Aluminium has made an all-time new high of 236.3 and declined. It can dig more upside from here. Before that, we may see retesting of 229 – 226.8 levels.
Afterward, it can move for the target of 233.6 – 236 – 238+.
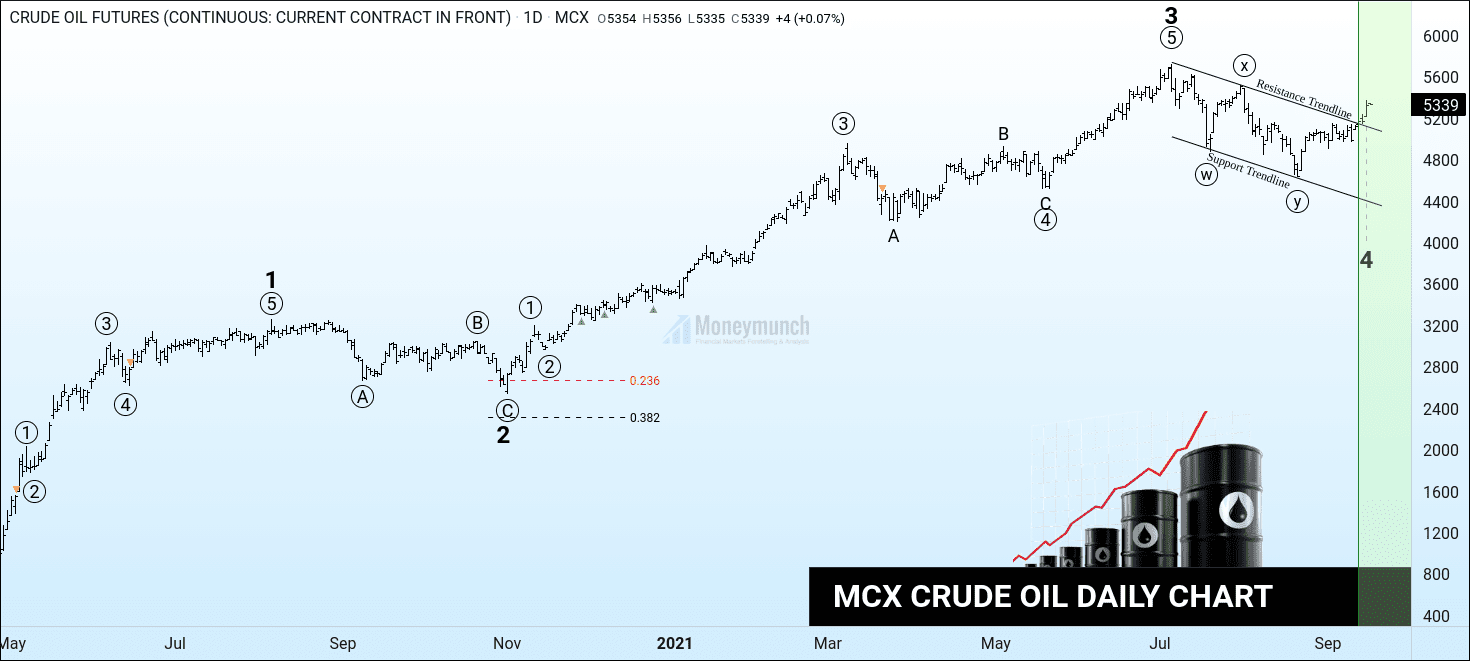
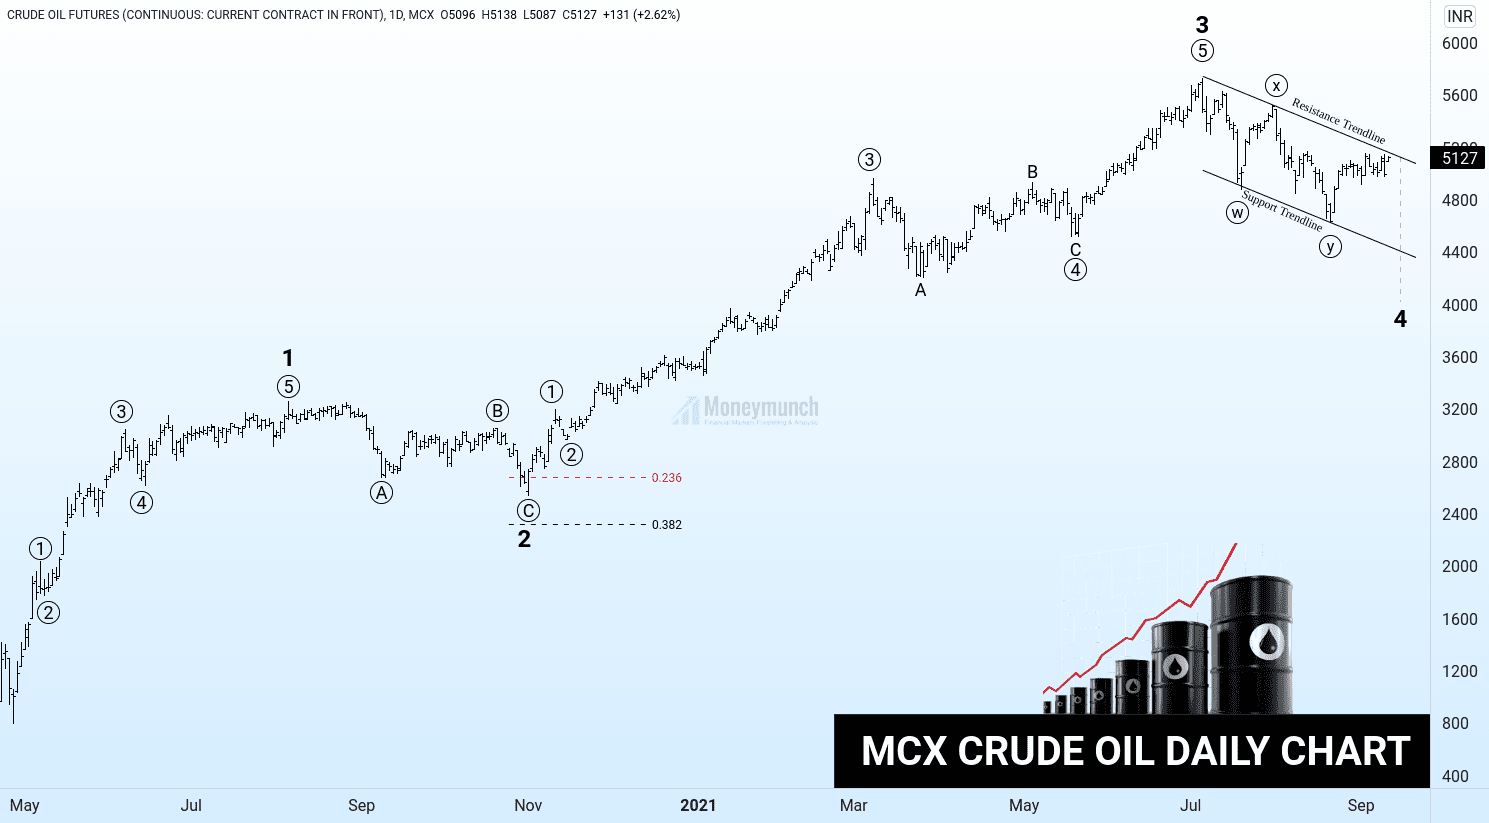
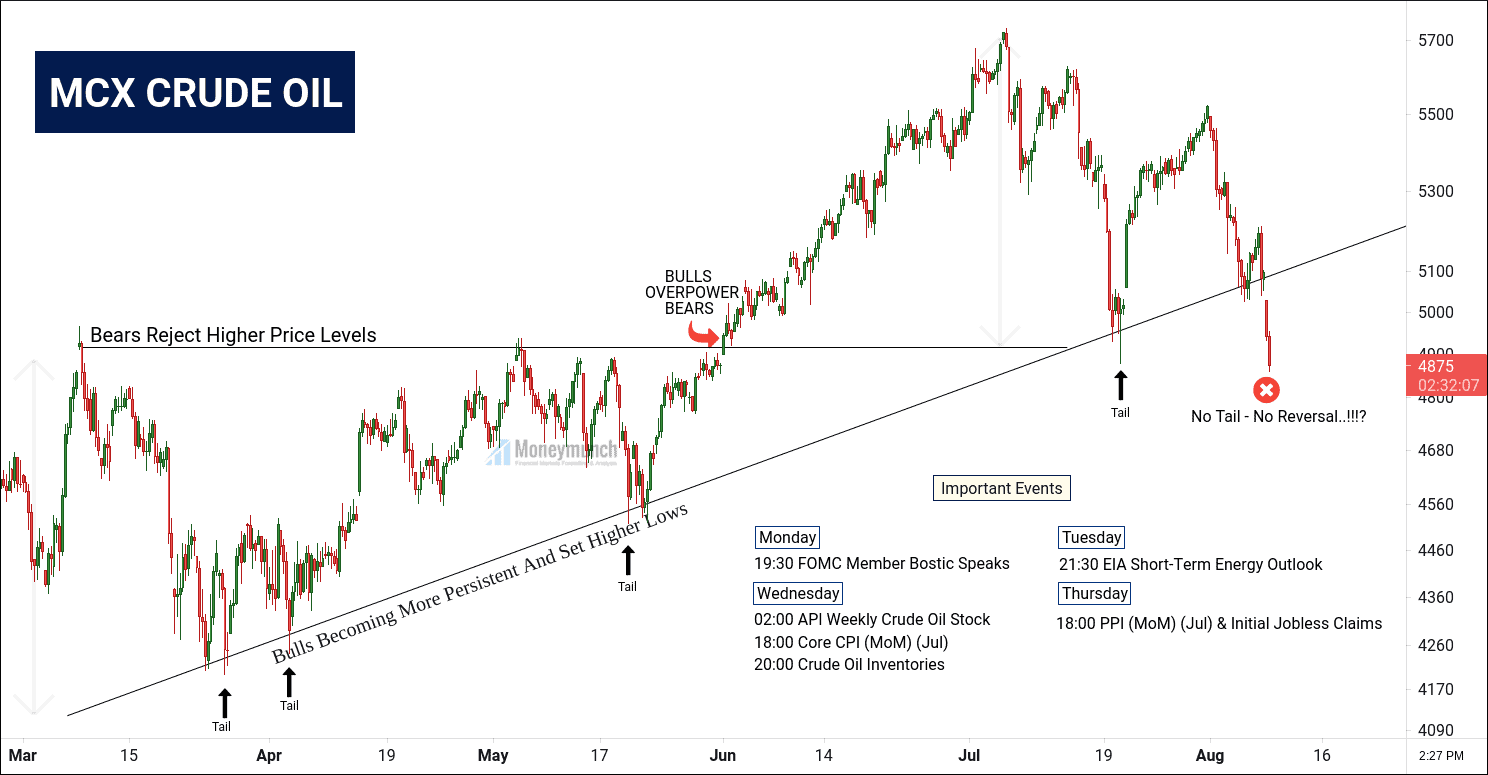
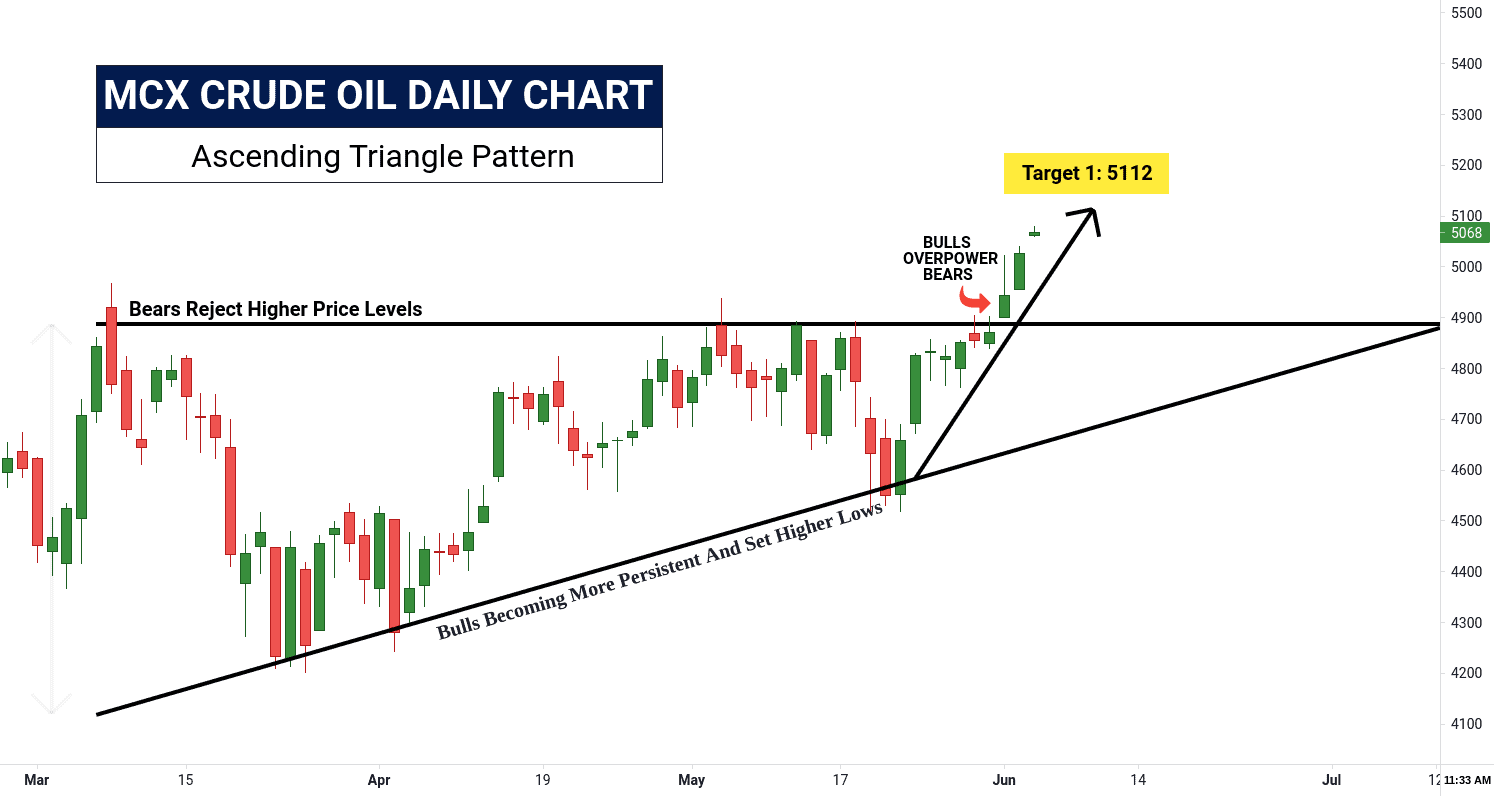
Latest Update: Crude Oil Call
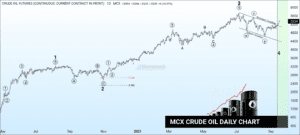
Crude oil has completed all targets in the previous week’s trading sessions.
Latest Update: Will Mentha Oil Touch 960 Level Again?
Mentha oil has touched the second target.
Continue reading