The Battle of Strategies: Buying Options vs. Selling Options
 Lock
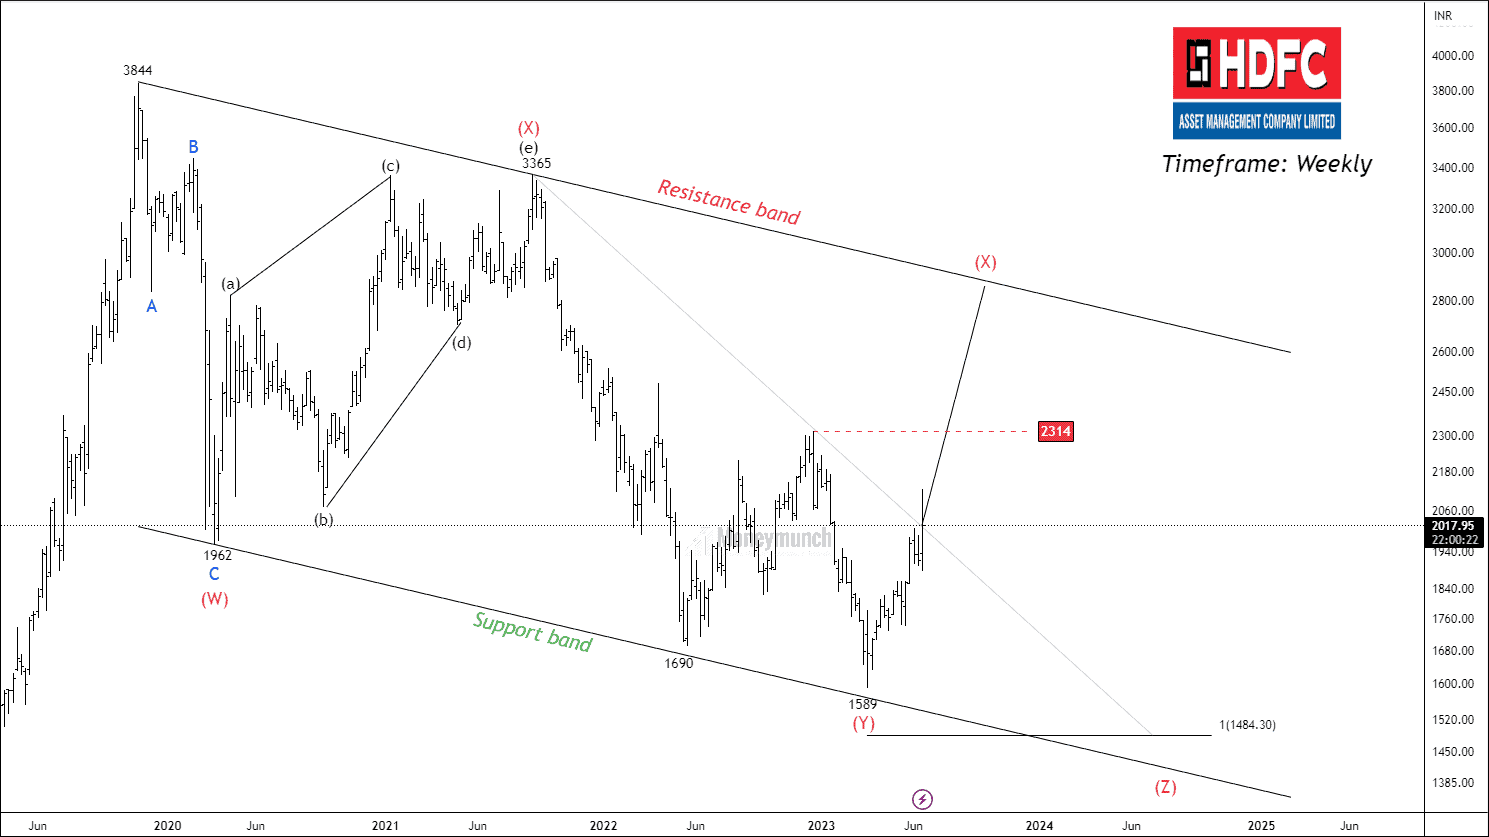
LockHDFCAMC – Correction Will Be Beneficial For the Bulls
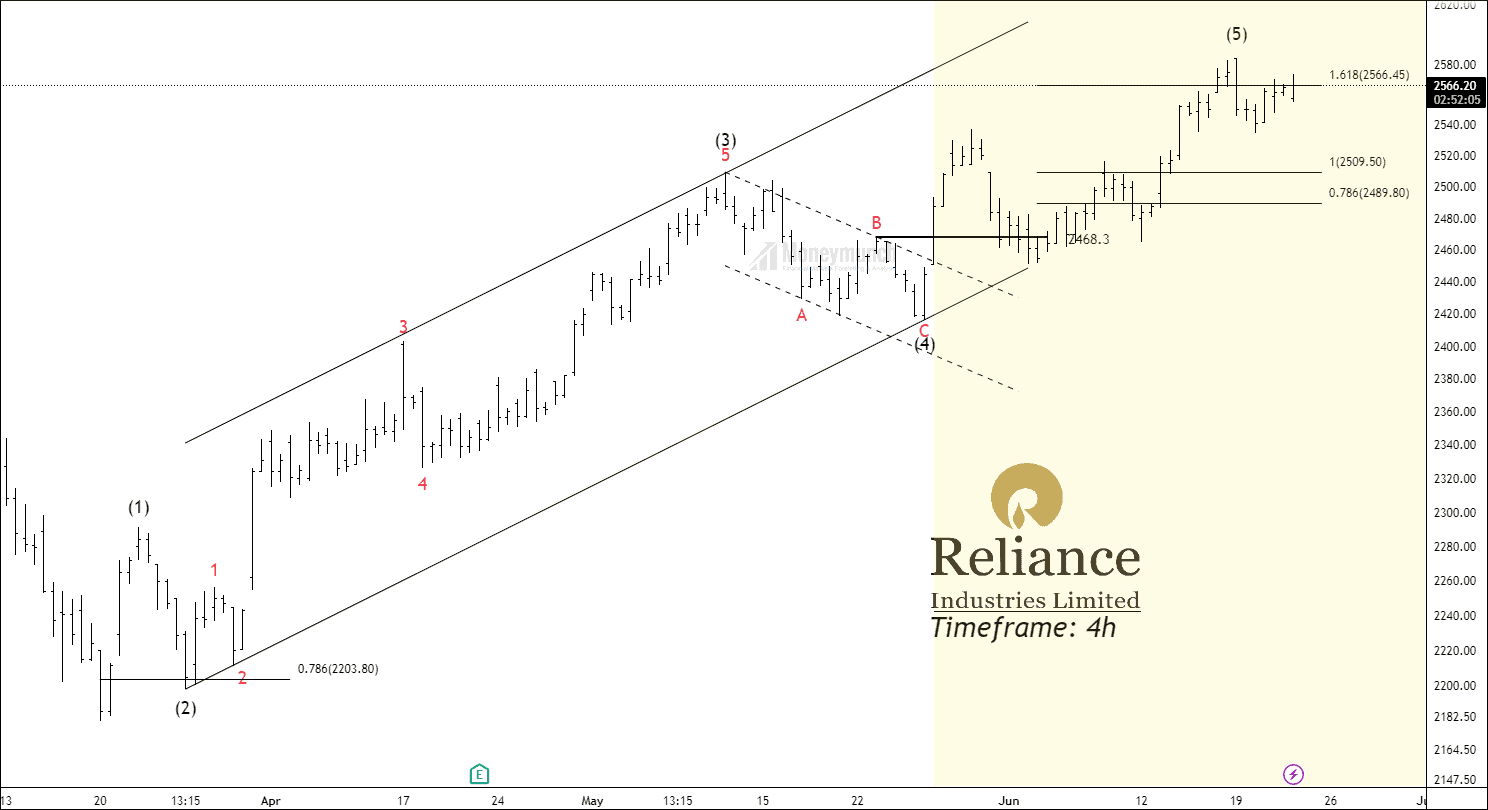
NSE RELIANCE – Bull Victory
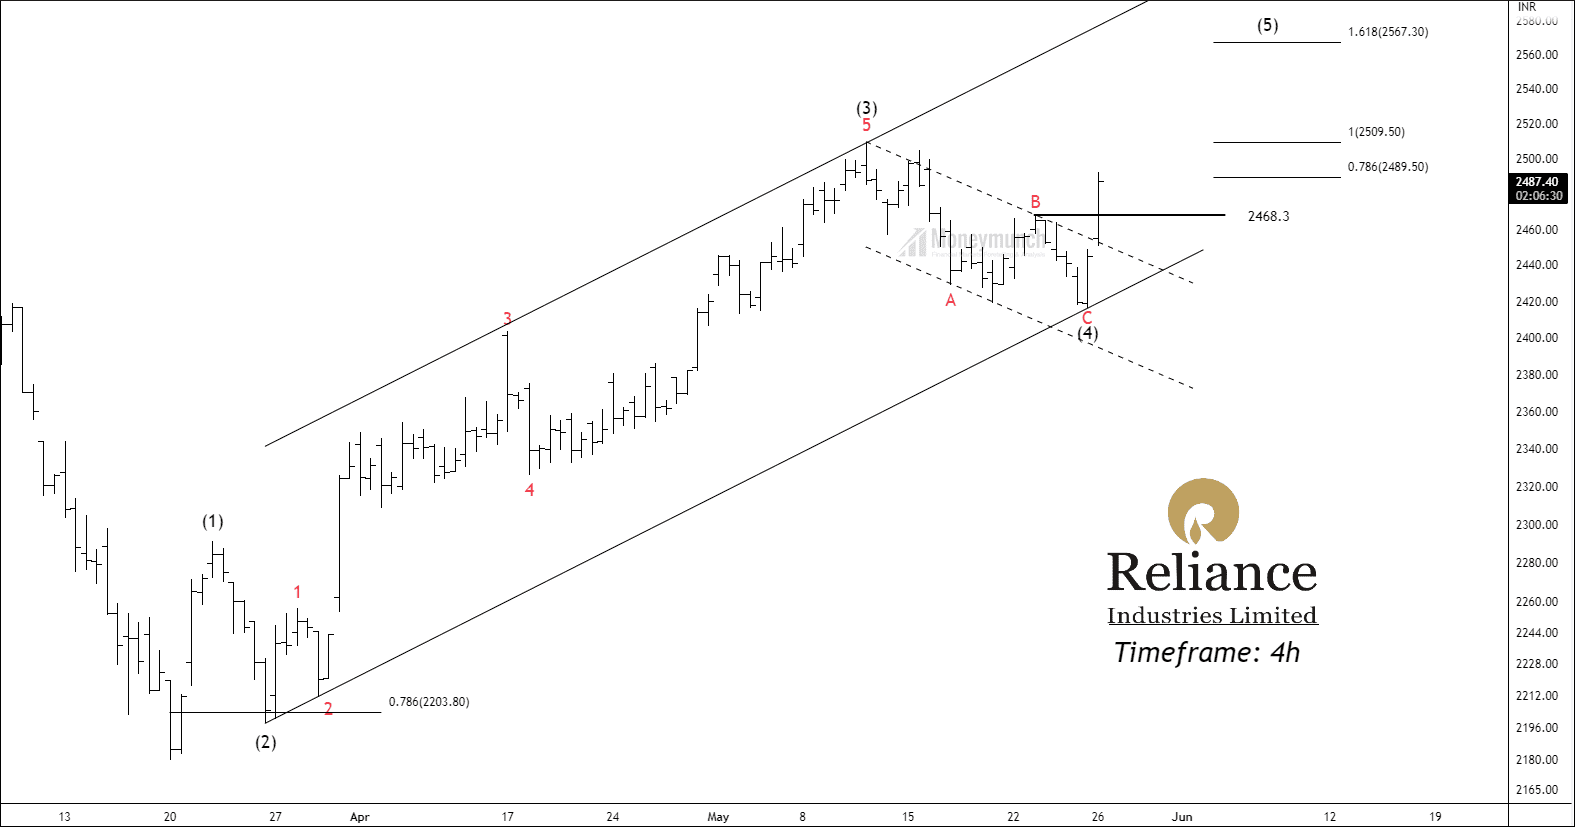
NSE RELIANCE – Unfolding The Final Impulse
Visit here: NSE RELIANCE – Unfolding The Final Impulse
 BEFORE
If the price maintains its position above wave B at 2468.3, traders can consider taking positions with the following targets in mind: 2509 – 2548 – 2567+.
 AFTER
AFTER
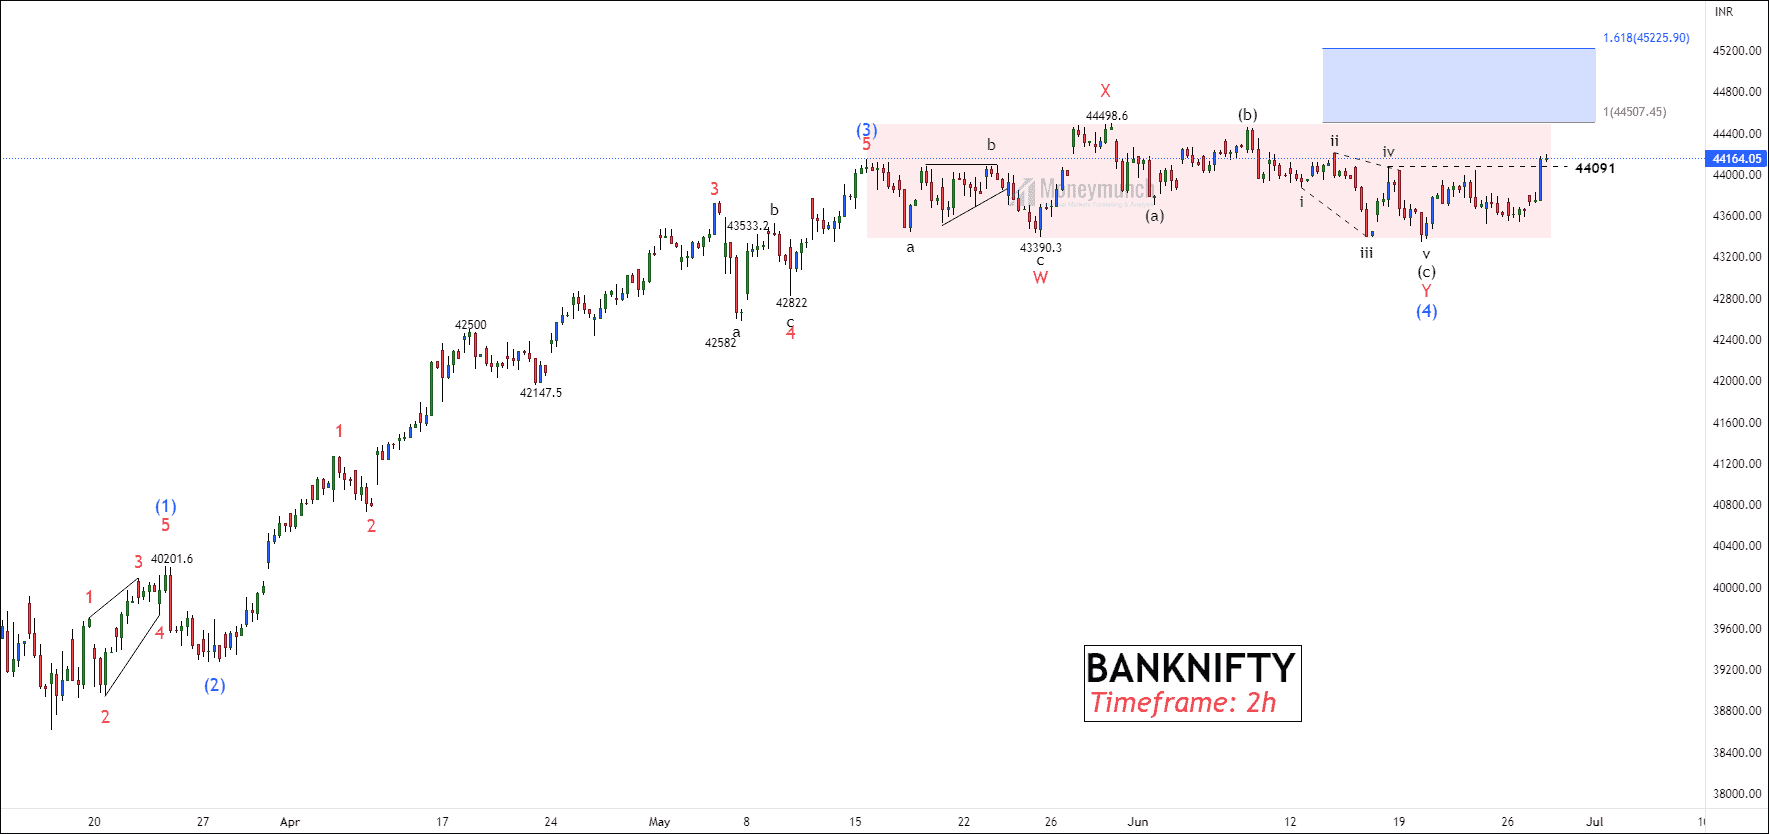
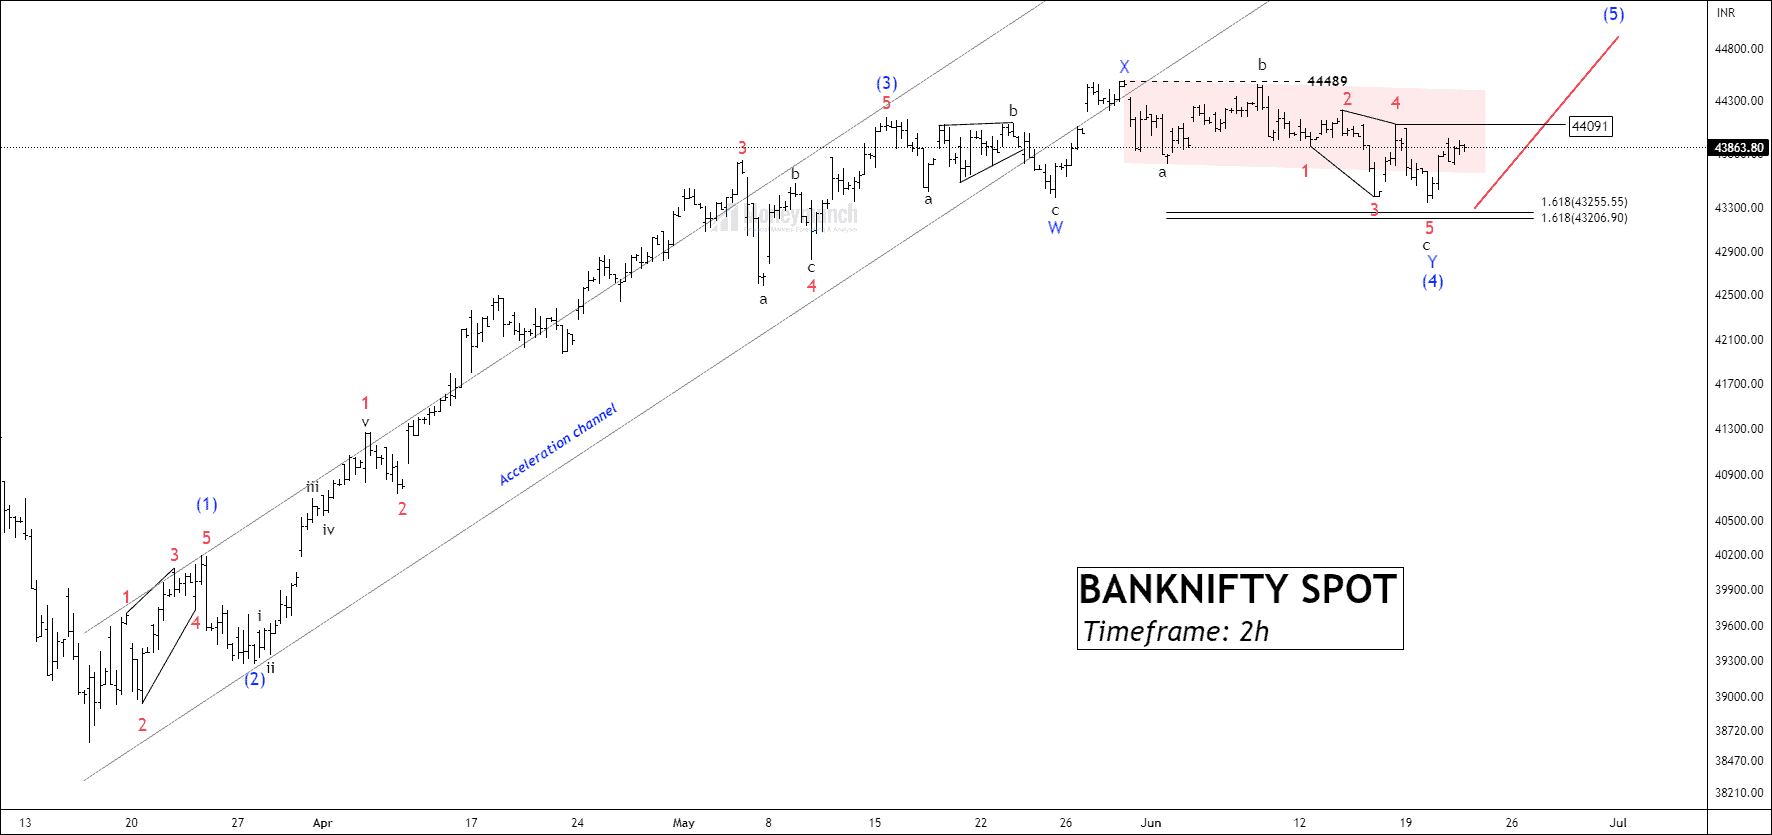
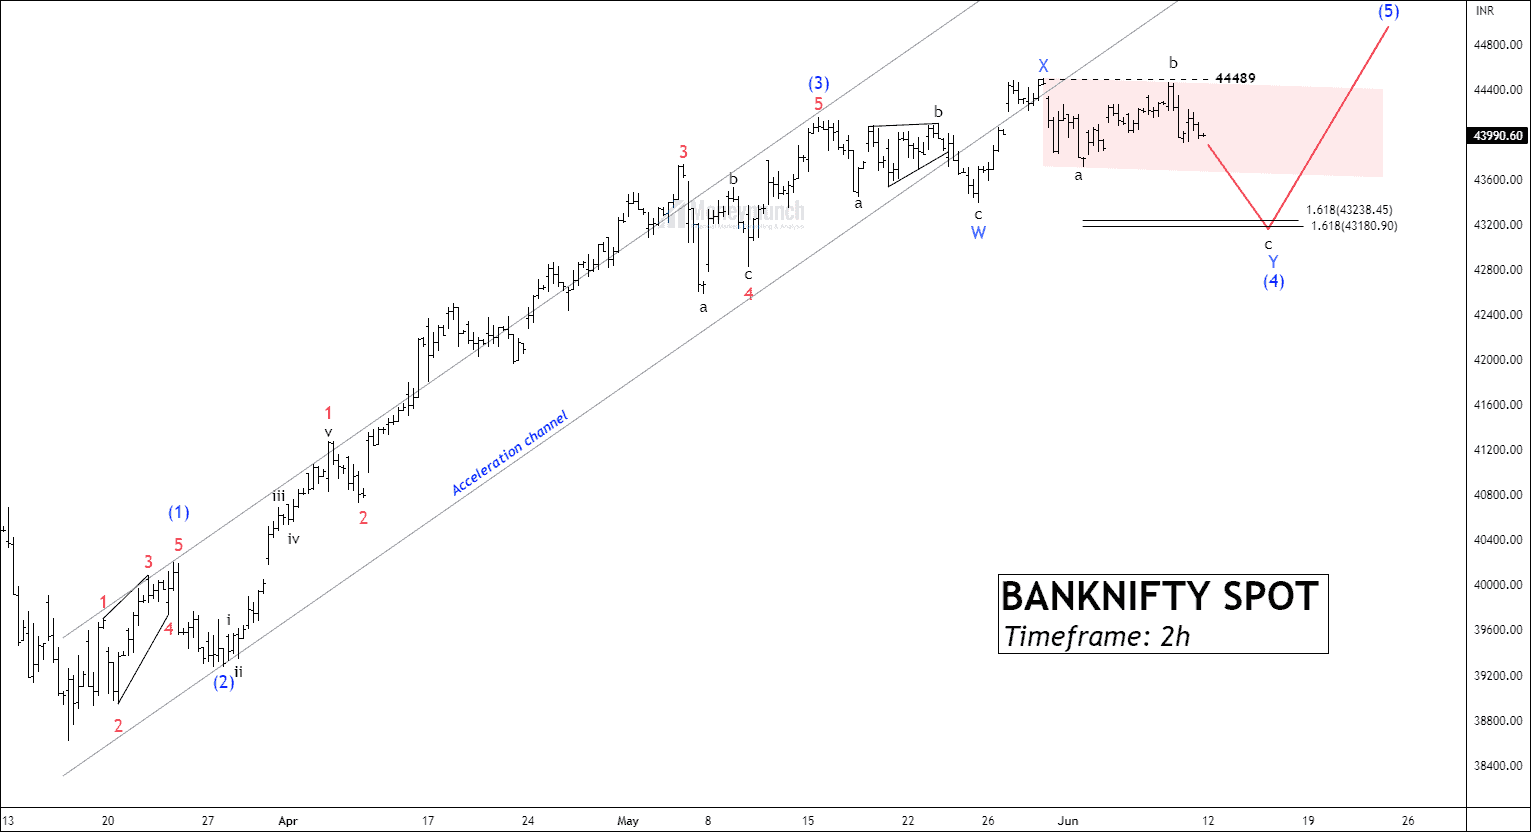
EWT – NSE BANKNIFTY Poised For Final Wave C
Tradesetup – NSE MRF & GODFRYPHLP
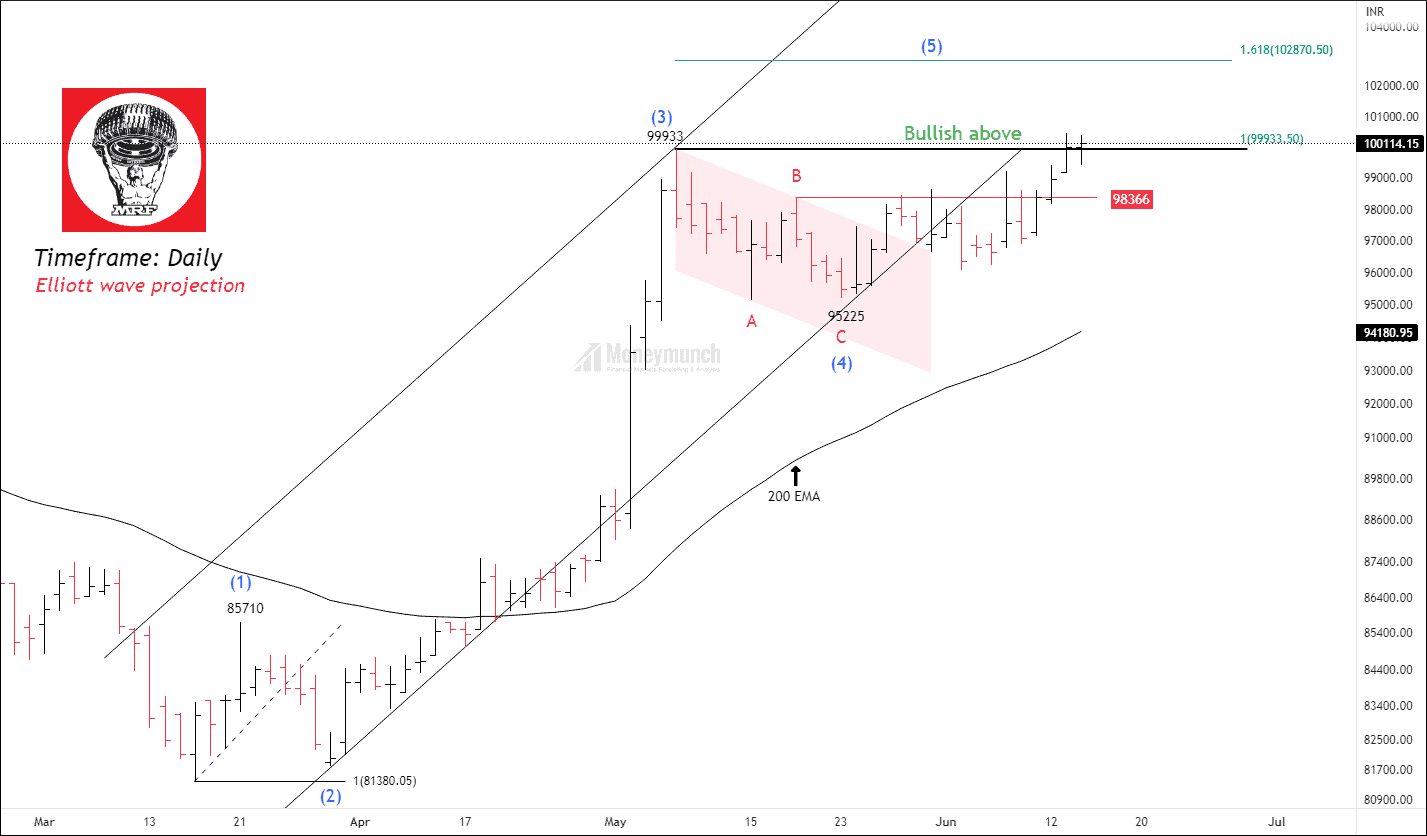
Timeframe: Daily
Based on our previous analysis, NSE MRF has been showing signs of forming an impulsive cycle starting from 81380. The price successfully completed impulsive wave C of wave (4) and is now on the verge of breaking the wave B, which would confirm the continuation of the upward move. Furthermore, the price is currently trading above the 50-day, 100-day, and 200-day exponential moving averages, indicating a bullish sentiment in the market. The RSI (Relative Strength Index) for MRF has also crossed the overbought threshold of 70 and reached a value of 70.91. Its a good opportunity to trade specialist breakout method.Continue reading
Shielding Your Investments: Exploring The Protective Put Strategy
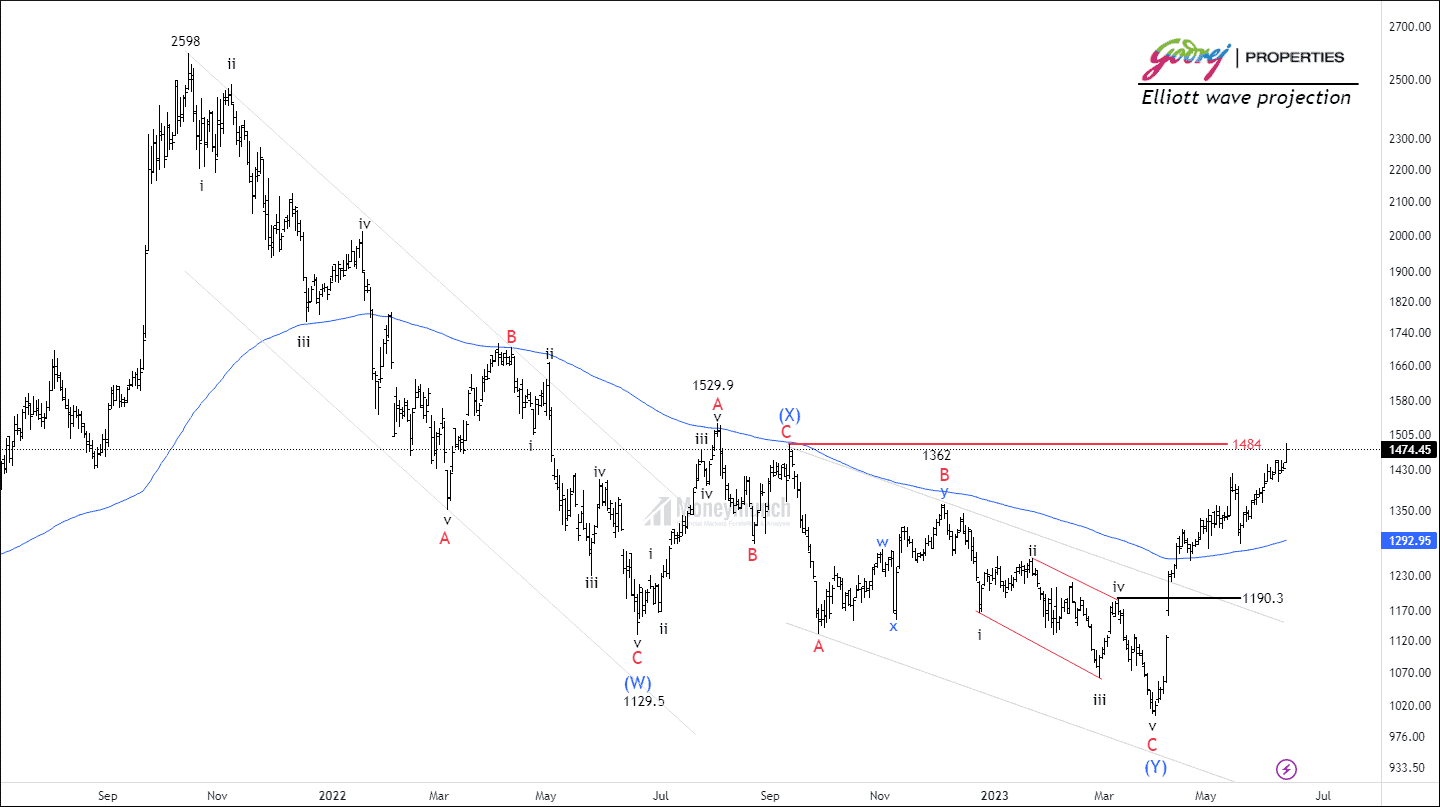
Trade Setup – NSE GODREJPROP & ASIANPAINTS
Generating Profits Safely: Exploring The Covered Call Strategy
MCX Crude Oil: Retracement Analysis and Downside Targets
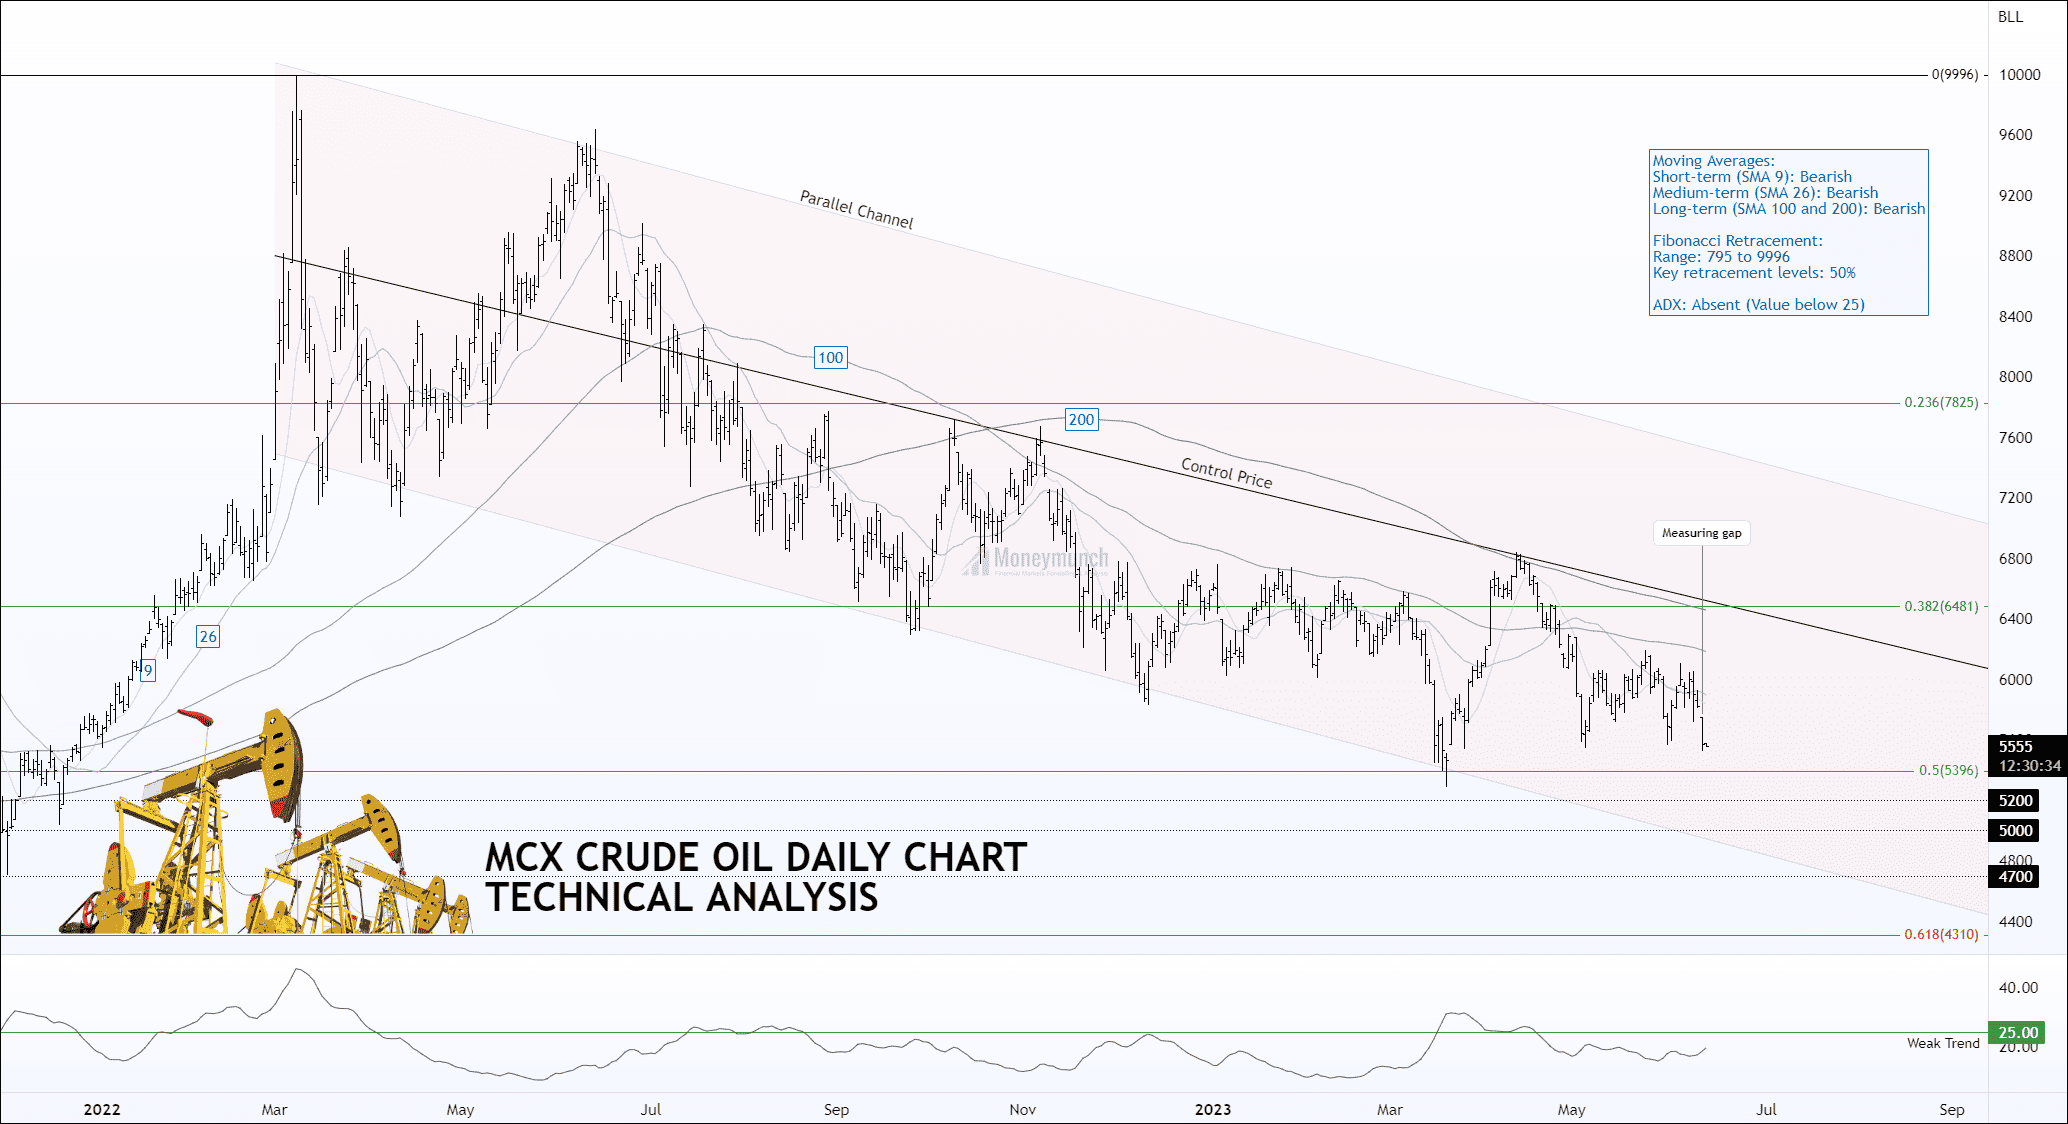
MCX Crude Oil: Will it Drop Below 5000 Before the Weekend?
In the wake of the COVID-19 pandemic, crude oil prices experienced significant volatility, hitting a low of 795 and reaching a peak of 9996 on March 8, 2022. Currently, the price is undergoing a retracement, approaching the key level of 50%.Continue reading
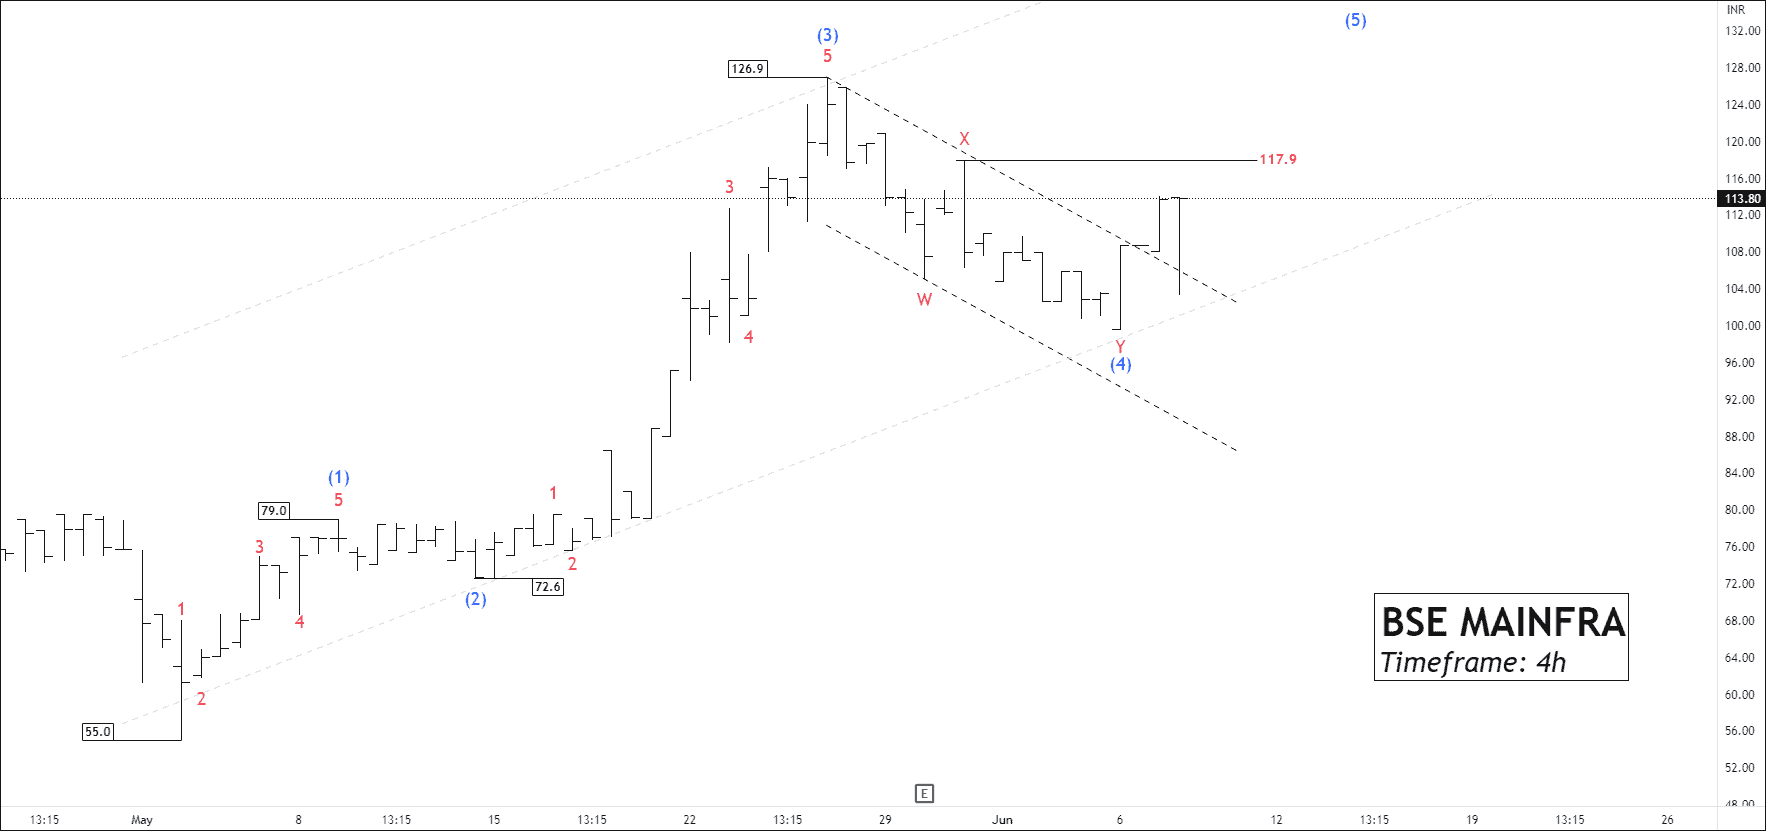
BSE MAINFRA – Trading Insights & Update
Have you executed trades using wave analysis on BSE MAINFRA?
Visit here: BSE MAINFRA – Unfolding Impulse Wave 5
 BEFORE
We had written clearly, “If the price breaks out above wave X at 117.9, traders may consider buying the stock with the following target levels: 126.9 – 139.2 – 148.3.”
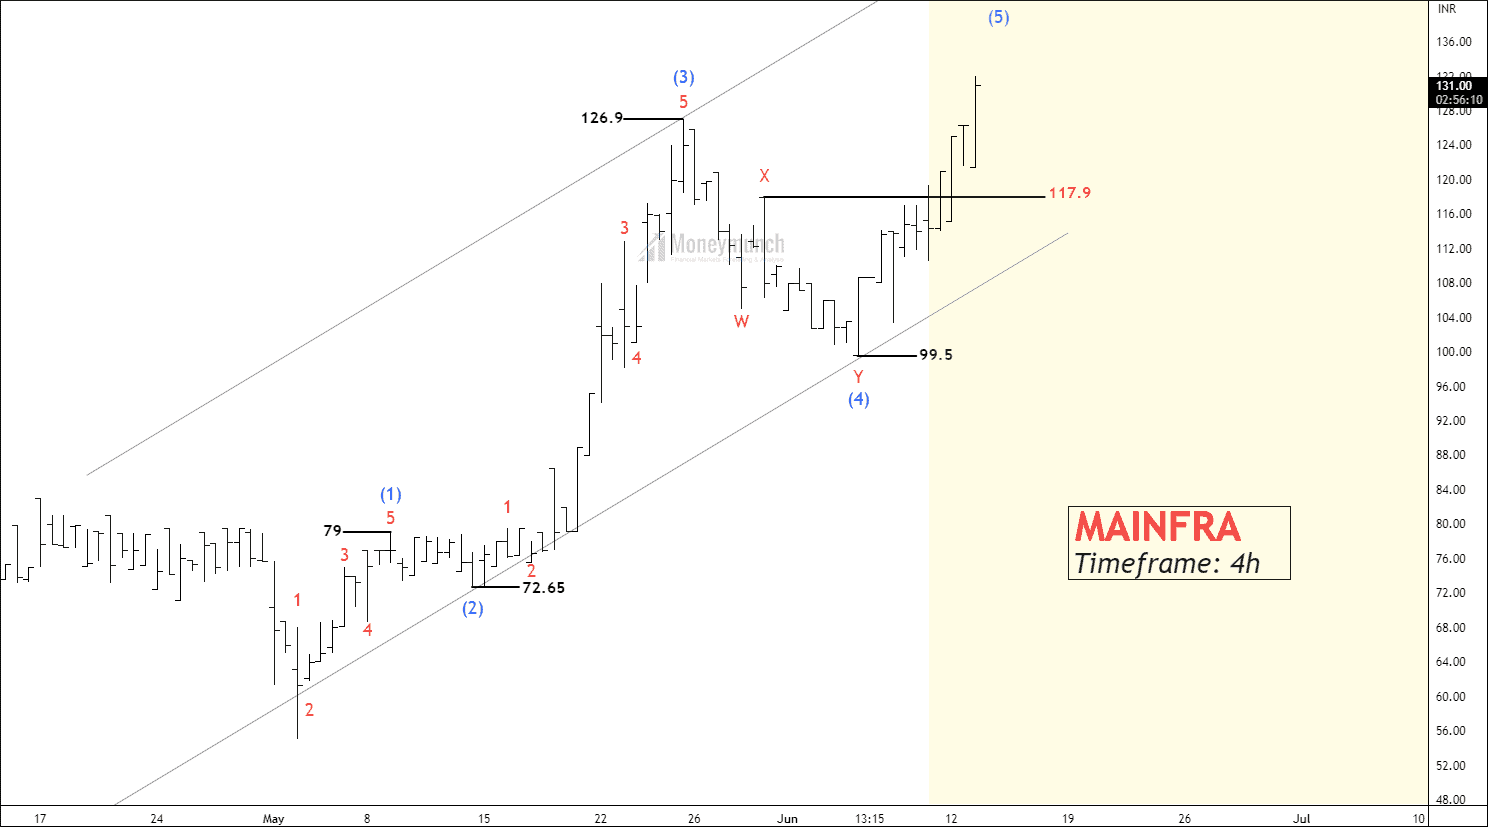 AFTER
AFTER
The Battle Of Strategies: Long Options Vs Short Options
NSE INFOSYS – Is This The Last Dip Before The Bull Charge?
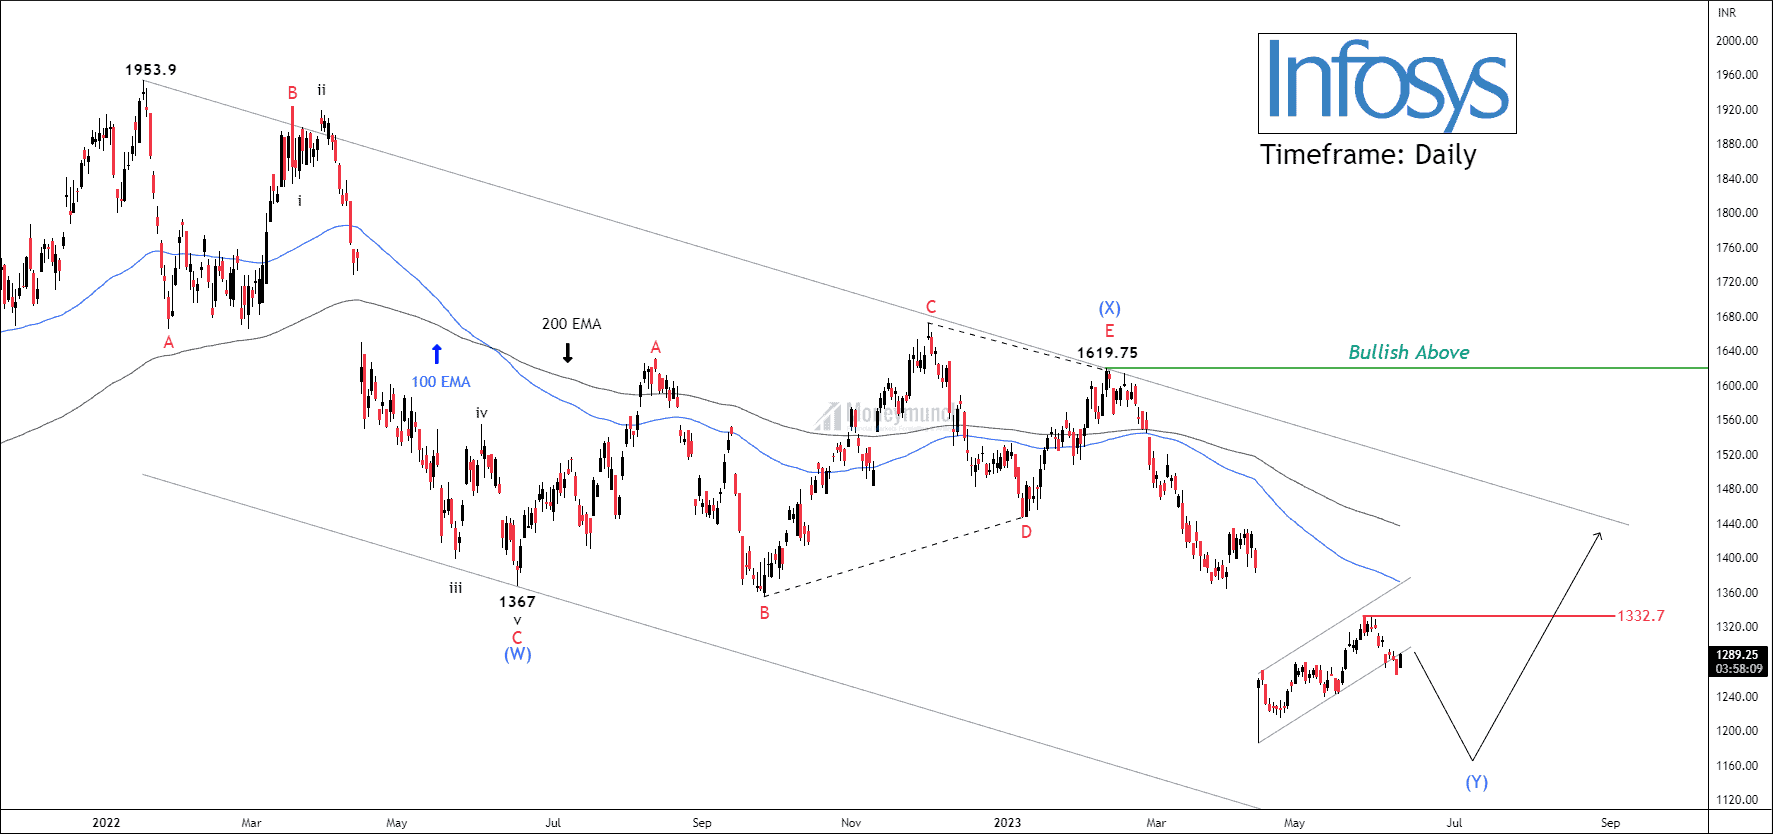
Timeframe: Daily
NSE INFOSYS has been experiencing a prolonged corrective phase lasting over 73 weeks, with its movement consistently below the 50/100/200 EMA. This indicates a bearish sentiment for the security. On the daily timeframe chart, price action has formed double three patterns.Continue reading
Diving Into Deep Waters: Exploring Liquidity In Option Trading
Silver Price Analysis: Exploring Resistance, Control Price, & Volume Dynamics
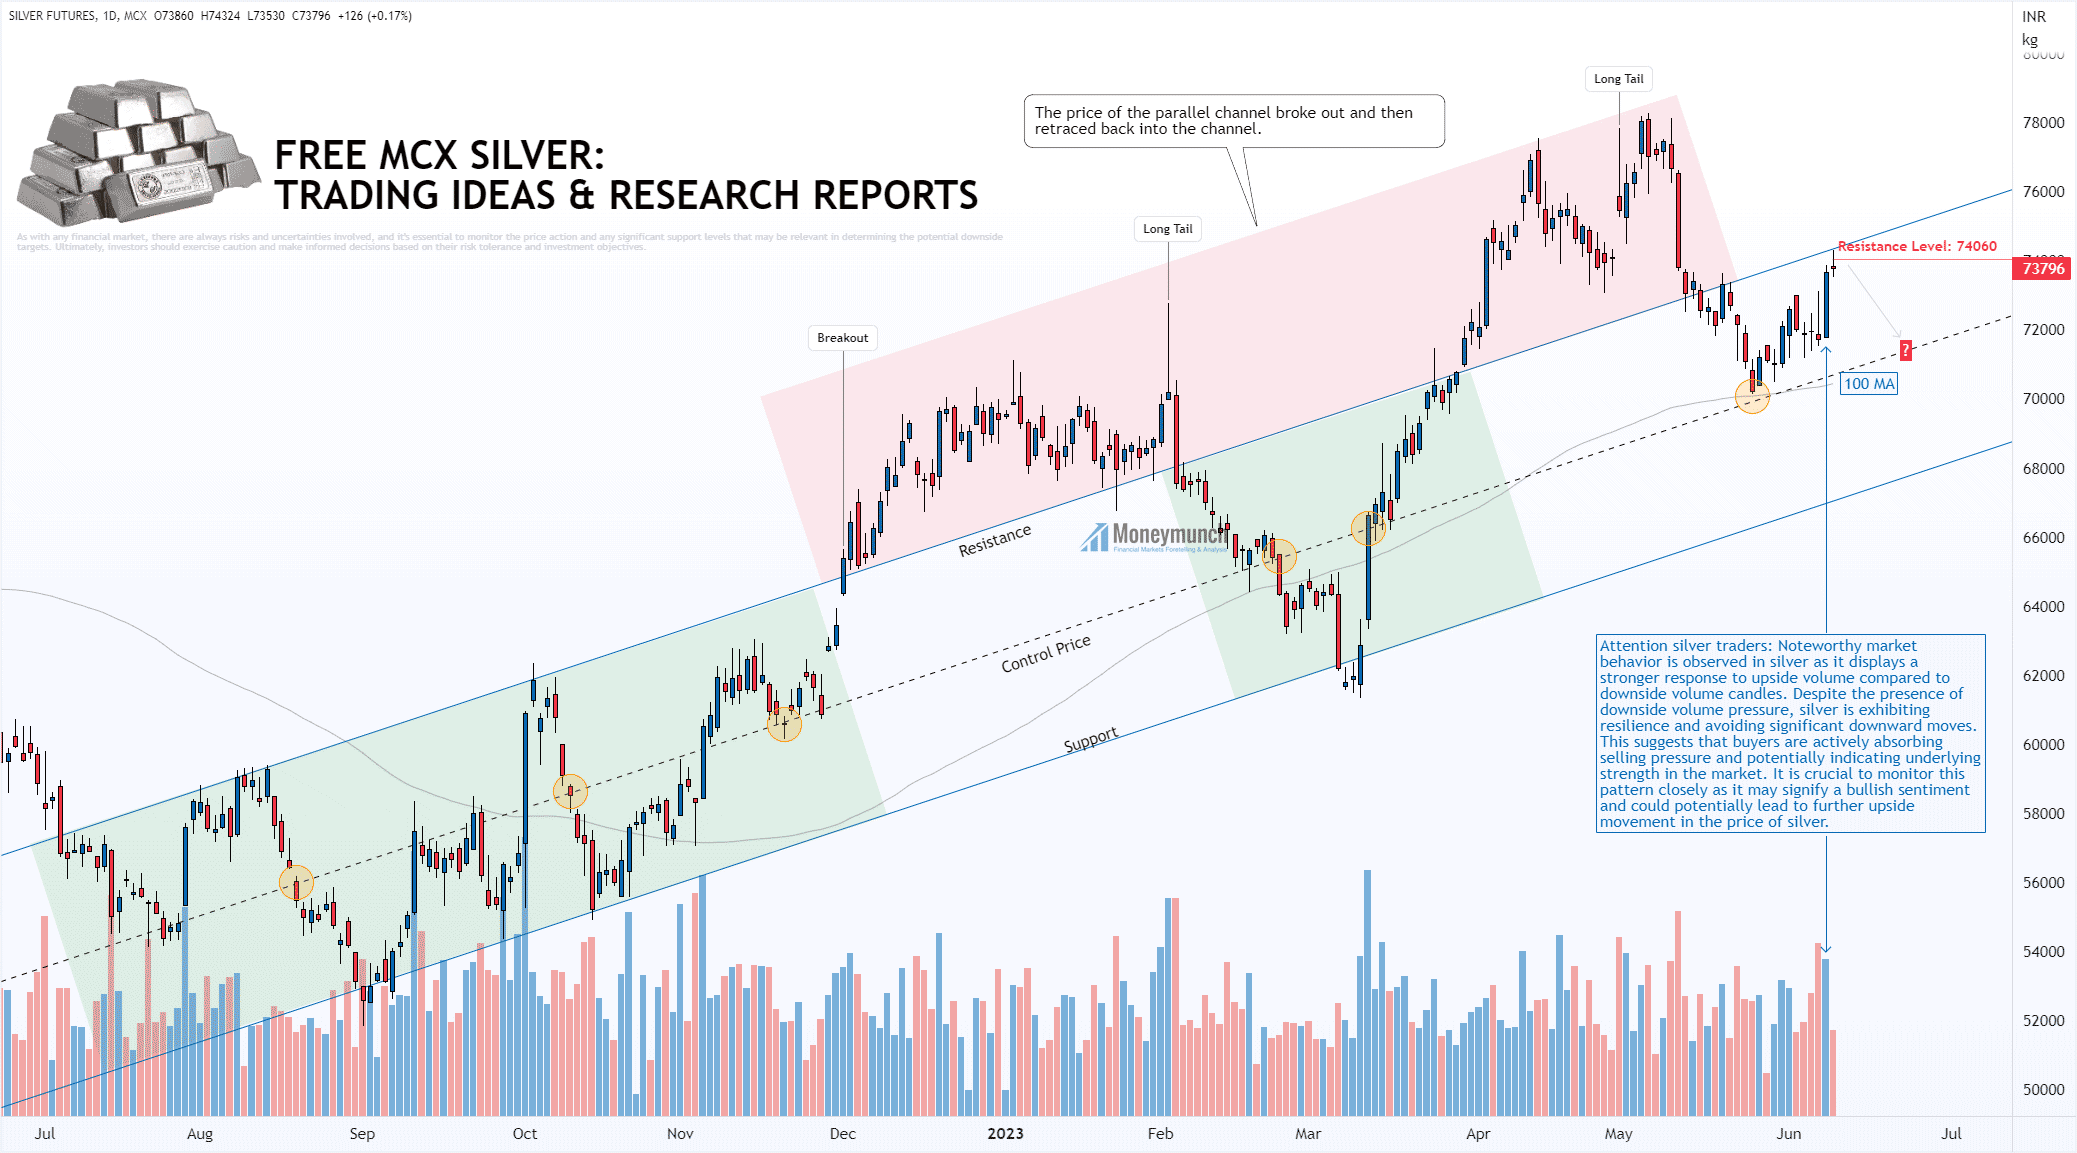
Examining the Parallel Channel and Resistance Levels for Short-Term Traders
Upon analyzing the chart, it is evident that silver has been trading within a parallel channel for almost a year, indicating a well-defined price range. In the previous trading session, the price of silver reached the resistance line of this channel. For short-term traders, a critical resistance level to watch is 74060. If this level is not surpassed convincingly, it could lead to a potential downturn towards the control price (CP) line. It is worth noting that silver has yet to test the CP line and the 100-day moving average (MA) successfully.Continue reading
EWT – Will The Bears Prevent BANKNIFTY From Reaching ATH?
Charting The Path: Option Trading Volume And Open Interest
Option and volatility: Unveiling The Relationship
TRADE SETUP – MAINFRA & POWERGRID
NSE ABBOTINDIA – Trading Insights & Update
Have you executed trades using wave analysis on NSE ABBOTT?
Visit here: NSE ABBOTT – Bullish Alert for Traders
 Continue reading