Timeframe: Weekly
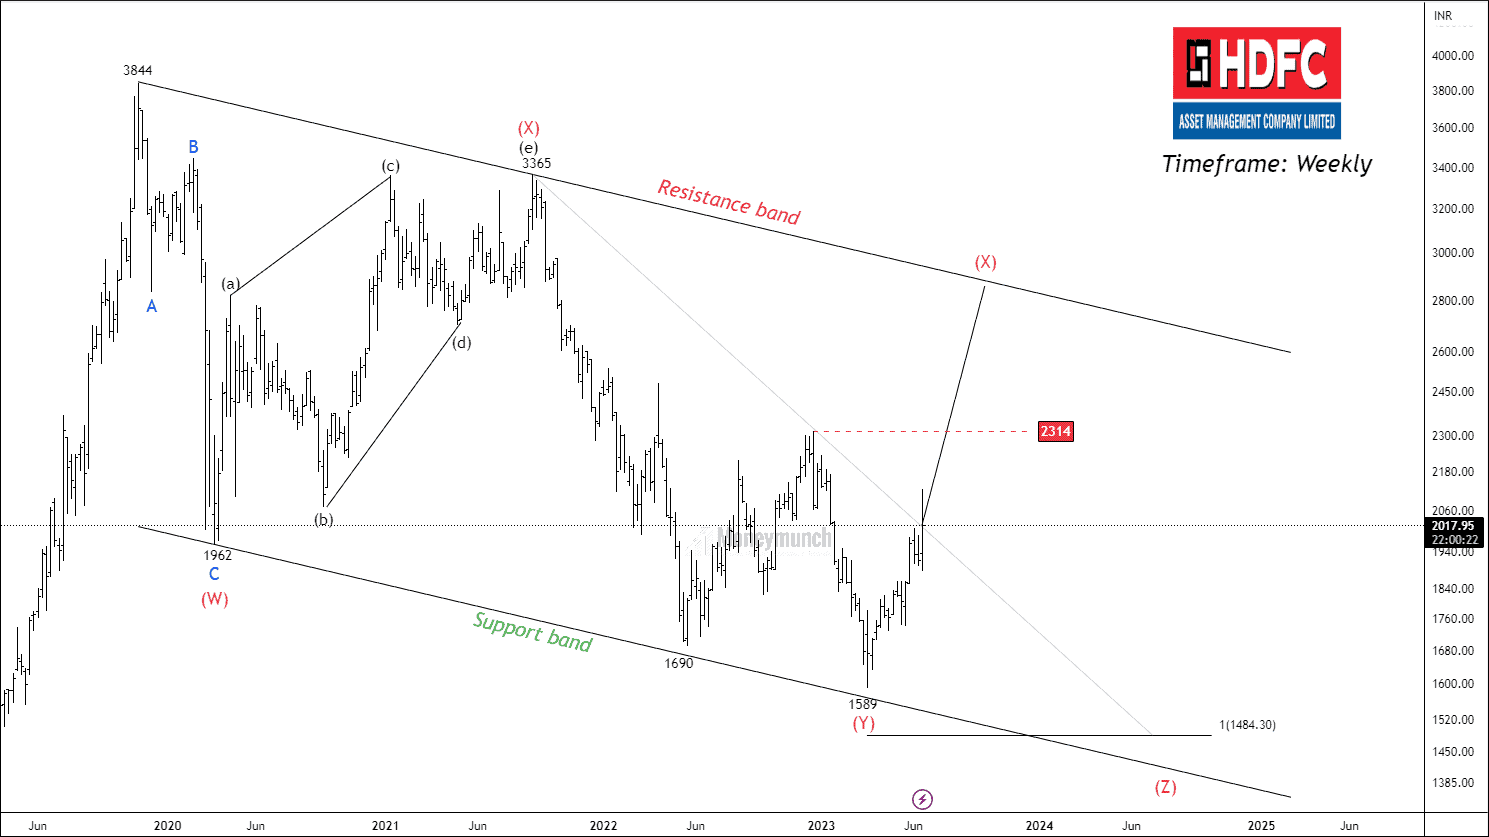
In our previous article, we discussed the corrective structure in the security market. On the weekly timeframe chart, we observed the formation of a double three pattern. After reaching the level of 2314, which we anticipated, the price has completed its downward move.
Upon further analysis, we have revised our wave count. Wave (w) has been successfully completed, and the price has now started to rise for wave (x) near a resistance band. Additionally, HDFCAMC has formed a wammie pattern, with its neckline located at 2314. This provides clear evidence of an unfolding upward move in the corrective wave X.
For traders interested in this opportunity, long above the neckline at 2100, with the following price targets: 2314 – 2588 – 2795+. However, it is important to note that once wave (x) completes, substantial selling pressure may be expected.
Get free important share market ideas on stocks & nifty tips chart setups, analysis for the upcoming session, and more by joining the below link: Stock Tips
Have you any questions/feedback about this article? Please leave your queries in the comment box for answers.
