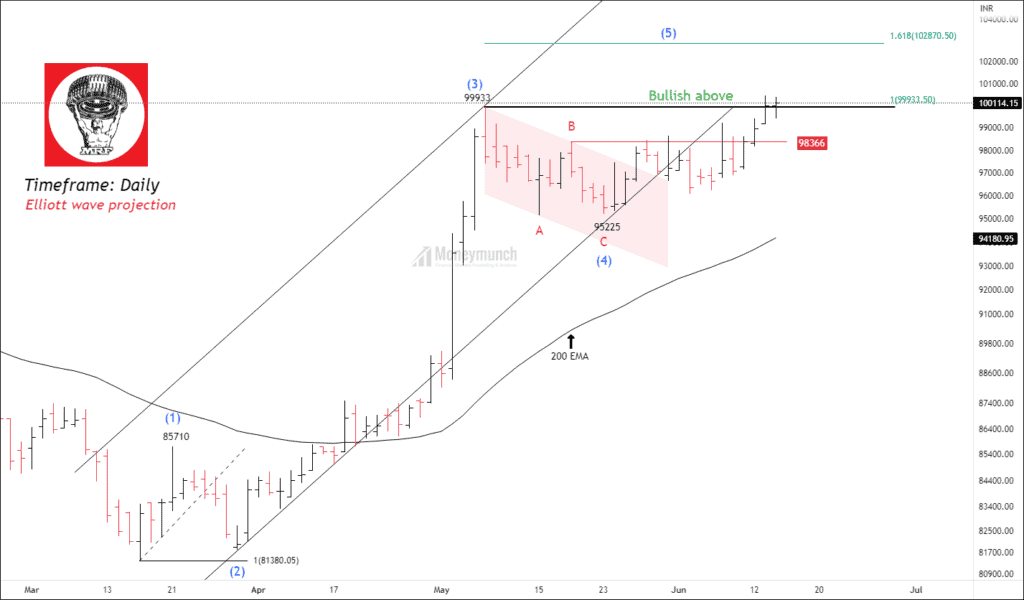
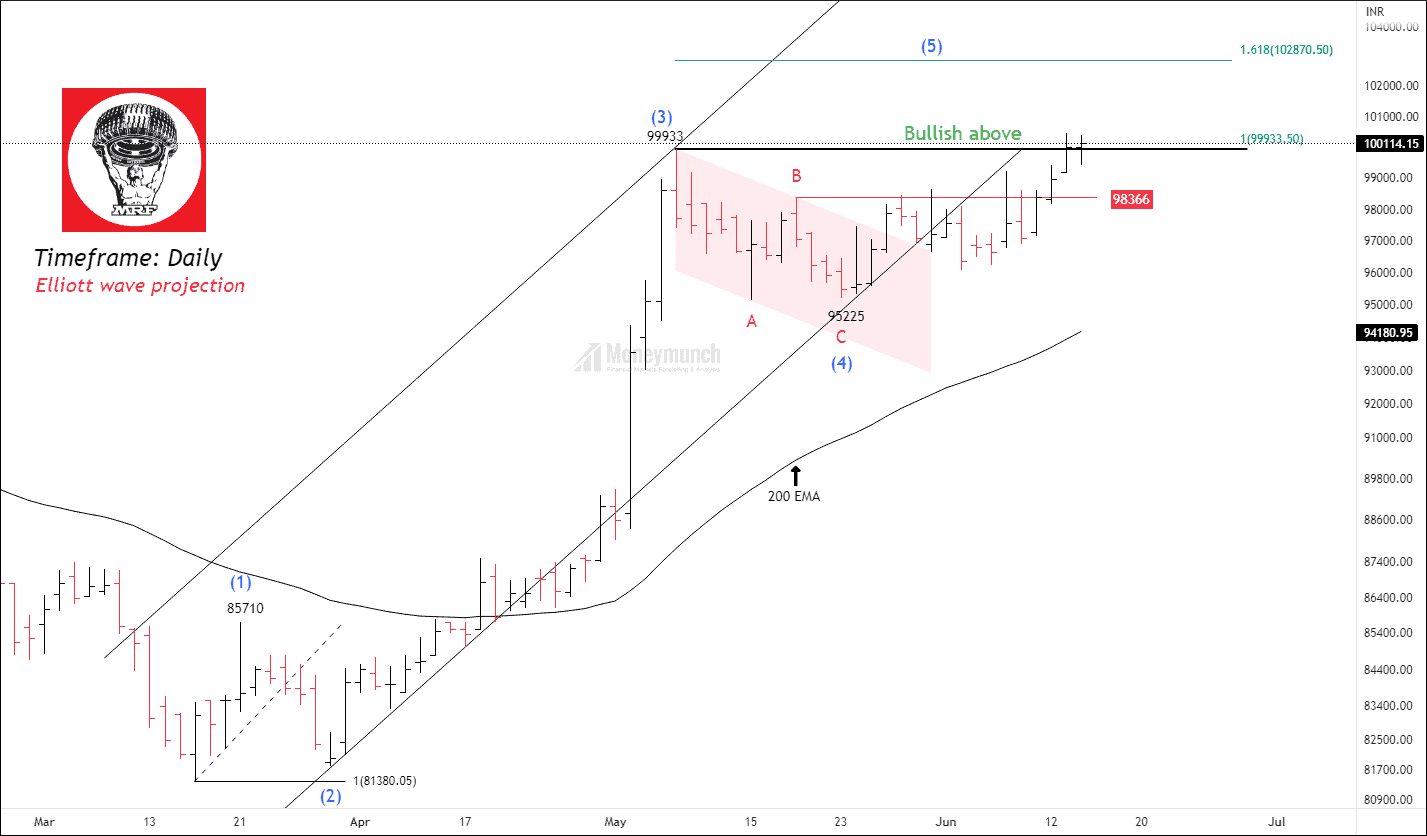
Timeframe: Daily
Based on our previous analysis, NSE MRF has been showing signs of forming an impulsive cycle starting from 81380. The price successfully completed impulsive wave C of wave (4) and is now on the verge of breaking the wave B, which would confirm the continuation of the upward move. Furthermore, the price is currently trading above the 50-day, 100-day, and 200-day exponential moving averages, indicating a bullish sentiment in the market. The RSI (Relative Strength Index) for MRF has also crossed the overbought threshold of 70 and reached a value of 70.91. Its a good opportunity to trade specialist breakout method.
Breakout Setup: NSE GODFRYPHLP Shows Promising Signs
As per the daily timeframe chart, NSE GODFRYPHLP is displaying strong indications. The price has formed a triangle pattern and a double bottom pattern, which are bullish patterns suggesting potential upward movement. Additionally, the price is currently trading above the 200-day Exponential Moving Average (EMA), further supporting the bullish momentum.
If the price successfully breaks out above the level of 1739, traders may consider buying the stock with the following targets in mind: 1782 – 1820 – 1856+.
Get free important share market ideas on stocks & nifty tips chart setups, analysis for the upcoming session, and more by joining the below link: Stock Tips
Have you any questions/feedback about this article? Please leave your queries in the comment box for answers.


 Lock
Lock