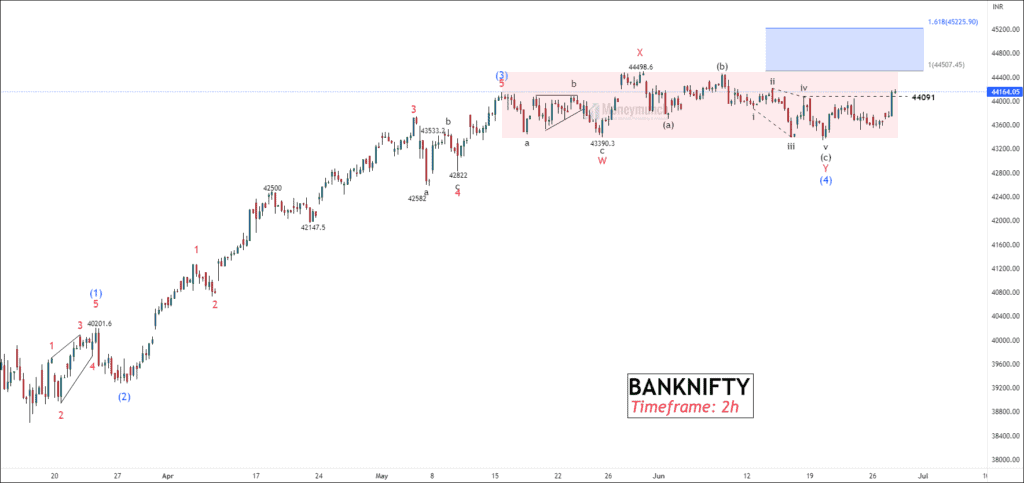
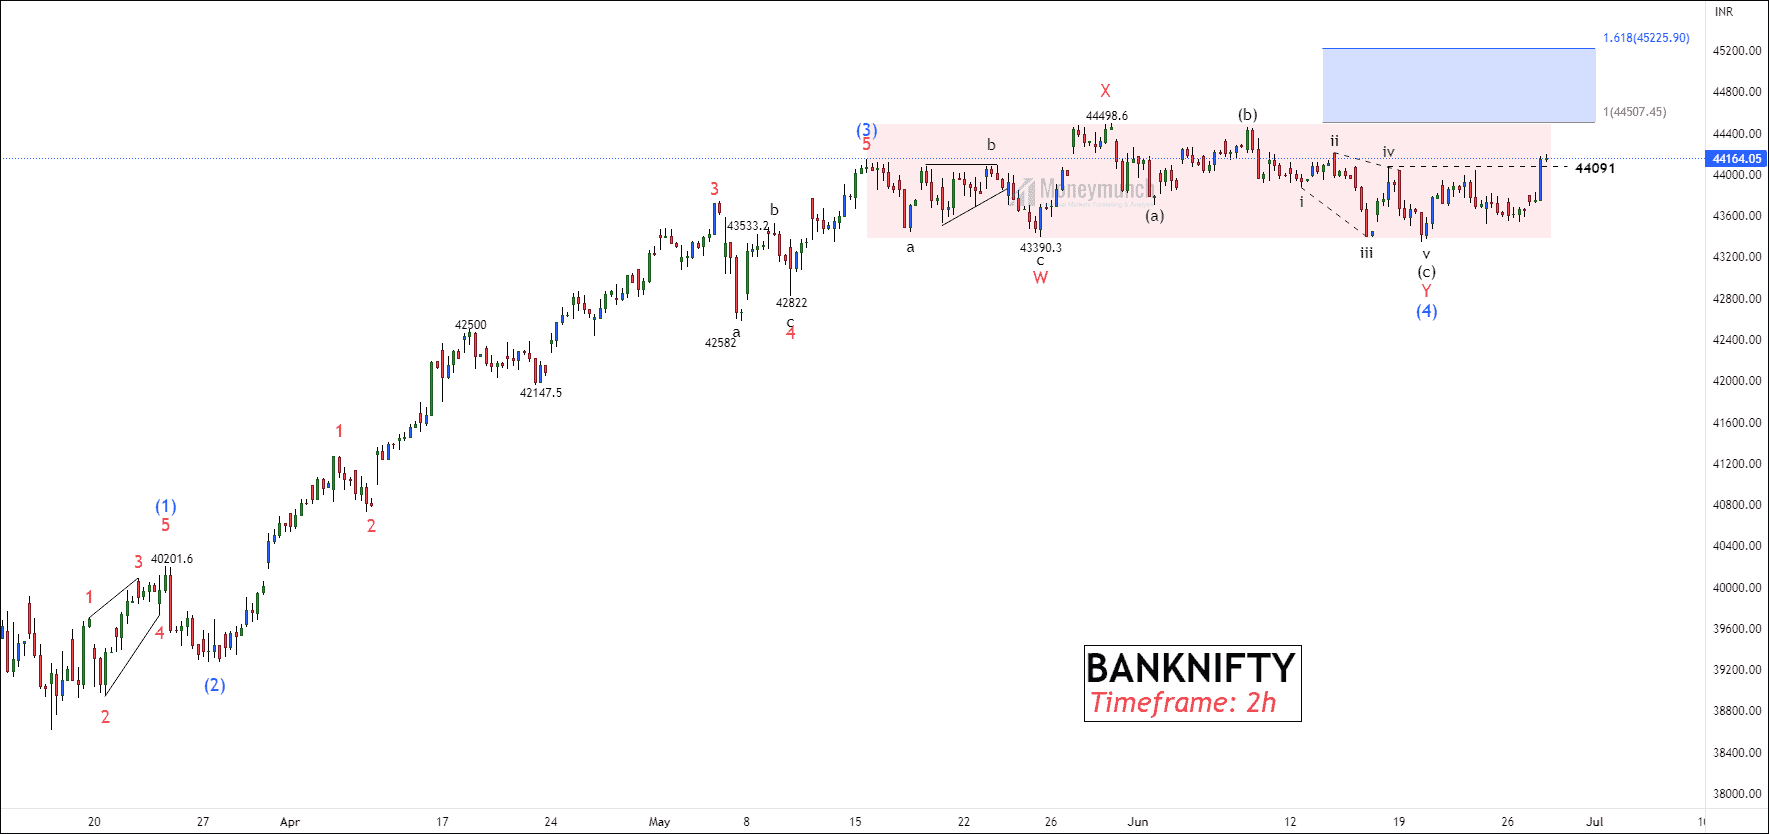
Timeframe: 2h
As per our previous article, we have calculated the probabilities for the violation of equilibrium. At a price level of 44154, we observed the occurrence of Wave (3), followed by a corrective phase known as Wave (4). The price has broken out 5 & 13 EMA with gigantic candles indicating bull dominance.
Wave (4) has broken out sub-wave 4 of the wave c diagonal of Y of (4). According to the wave principle, the current trend can be changed after the breakout of the previous corrective sub-wave. Traders’ eyes are on 44091. If the price sustains above 44091, traders can buy for the following targets: 44430 – 44840 – 44912+. These targets are the same as the previous analysis. Reverse fibonaaci from wave 3 to wave 4 suggests the maximum move is up to 161.8% at 45225.
Get free important share market ideas on stocks & nifty tips chart setups, analysis for the upcoming session, and more by joining the below link: Stock Tips
Have you any questions/feedback about this article? Please leave your queries in the comment box for answers.

