Timeframe: 2h
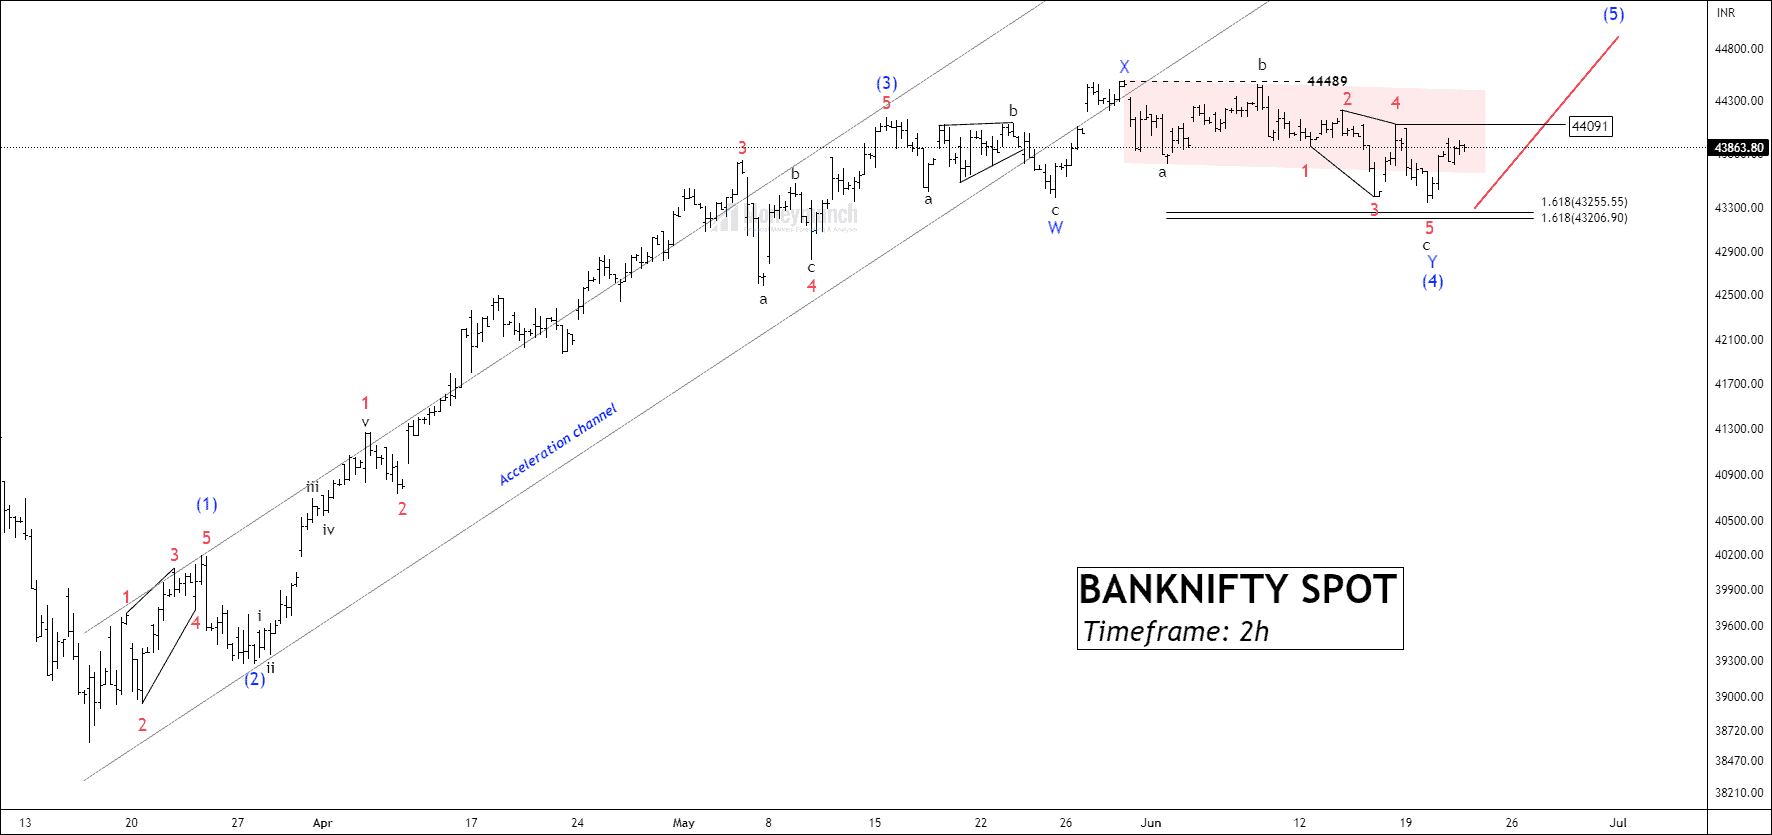
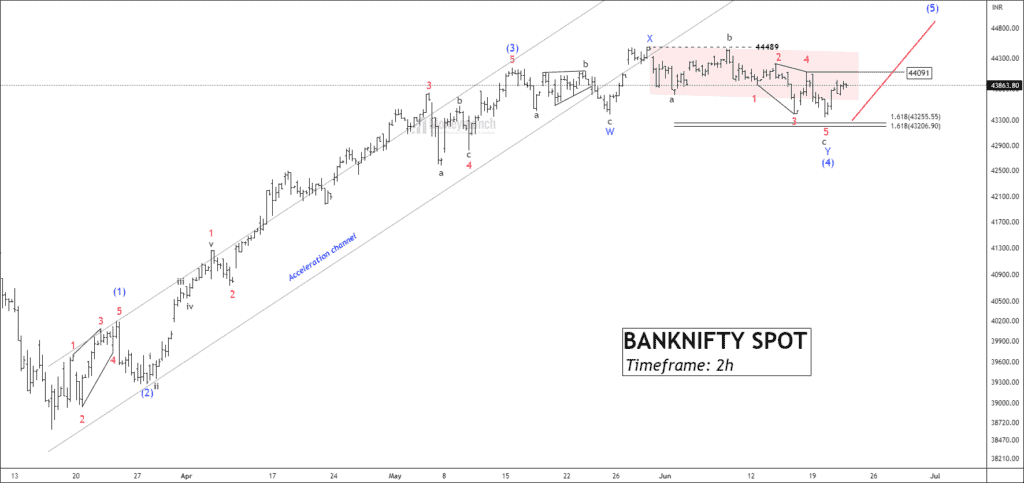
As per our previous idea, we have identified a market scenario characterized by supply pressure and bear dominance. At a price level of 44154, we observed the occurrence of Wave (3), followed by a corrective phase known as Wave (4). Wave (4) exhibited a double three pattern.
Currently, the price is in the process of forming the final sub-wave (c) of Wave (y) within Wave (4). Wave (c) has taken the shape of an ending diagonal, suggesting that a breakout above the upper boundary of the diagonal in Wave 4 of Wave (c) could potentially lead to a new high. To take advantage of this potential upward movement, traders may want to consider entering trades as long as the price remains above 44091 for following targets: 44430 – 44840 – 44912+.
Note that if the price fails to break the resistance level at 44091, the trade setup loses its validity. For traders who are more tolerant of risk, an alternative strategy could involve entering a trade after a reversal occurs from the support level at 43200.
Get free important share market ideas on stocks & nifty tips chart setups, analysis for the upcoming session, and more by joining the below link: Stock Tips
Have you any questions/feedback about this article? Please leave your queries in the comment box for answers.

Excellent job on the analysis! Your attention to detail and ability to identify the formation of Wave C in BankNifty is highly appreciated.
expertise in Elliott Wave Theory shines through in this analysis. It’s evident that you have a deep understanding of market dynamics and patterns.
spot-on!
Fantastic analysis
Thank you for sharing