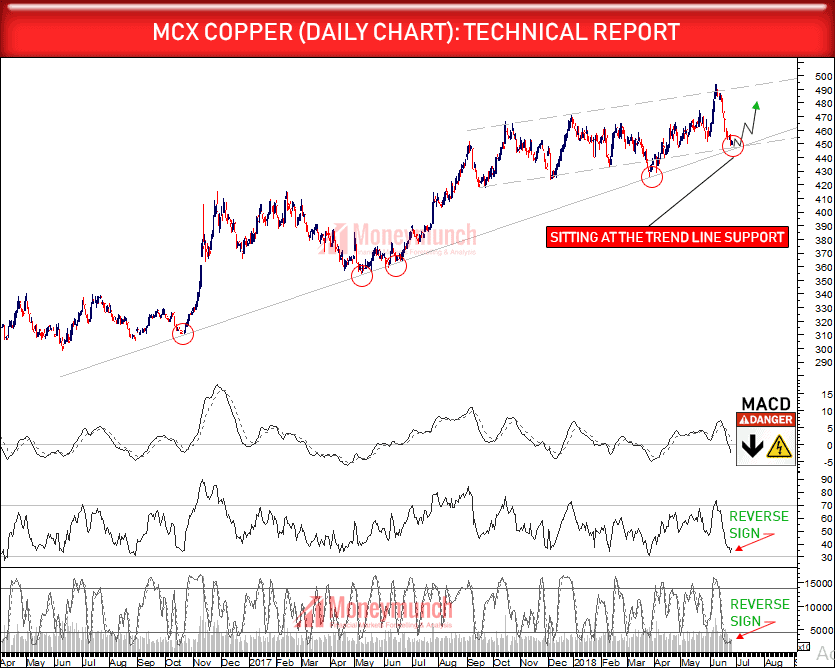
Will copper touch the 2013 year High level (512.6)?
In last 12 trading session copper has lost 38 rupees. As per the above chart, it is sitting at the trend line support of 2017. Is it a gesture that from this support line it will touch 2013’s high of Rs.512.65? Except MACD other indicators & studies are suggesting a strong bullish trend ahead.
Target: 462 – 470 – 486+
Caution: we do not recommend to hold below the support line but initiate a new position repeatedly above support line for the targets.
To become a subscriber, subscribe to our free newsletter services. Our service is free for all.
 Almost 200 Points Profit on the last Crude oil Call
Did you read crude oil report? If not, click here.
I had said Monday that “as per the technical analysis, crude oil will remain on the uptrend. We might see soon: 4740 – 4800 – 4860+”.
In just 3 trading sessions, it has hit all target. (Almost 200 points per lot)

Update on Report of Silver – Correction Over?
Did you read Silver report? If not, click here.
It has touched the first target on Monday. Nowadays it is a slightly moving downside. Do you think will the next target come?
Get free MCX ideas, chart setups, and analysis for the upcoming session: Commodity Tips →
Have you any questions/feedback about this article? Please leave your queries in the comment box for answers.
