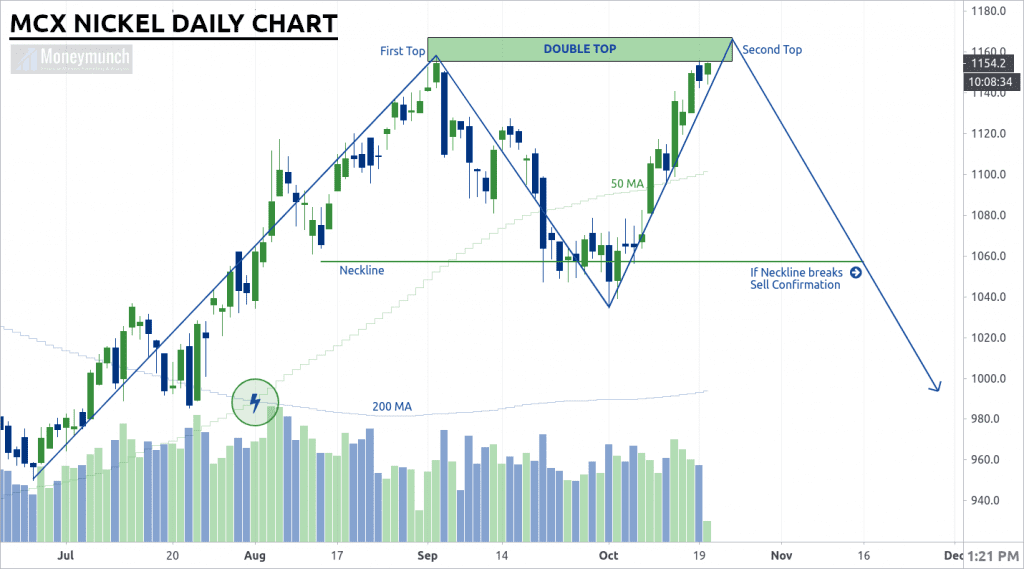

According to this chart, MCX Nickel is making a double top chart pattern. It’s at risk of a bearish trend after double top formation. Wherein the first top at 1158.4 level, and the second top can be between the range of 1160 – 1176.
If it’s a second top, nickel will make a large false break pin bar here. That might be up to the 1176 level. Afterward, the short-term traders can sell it for levels of 1106 – 1076 and below.
Here I have drawn a neckline as a support trendline to get an accurate exit/entry point.
Wait for the right entry-level, don’t sell above 1160 level.
To become a subscriber, subscribe to our free newsletter services. Our service is free for all.
Get free MCX ideas, chart setups, and analysis for the upcoming session: Commodity Tips →
Have you any questions/feedback about this article? Please leave your queries in the comment box for answers.