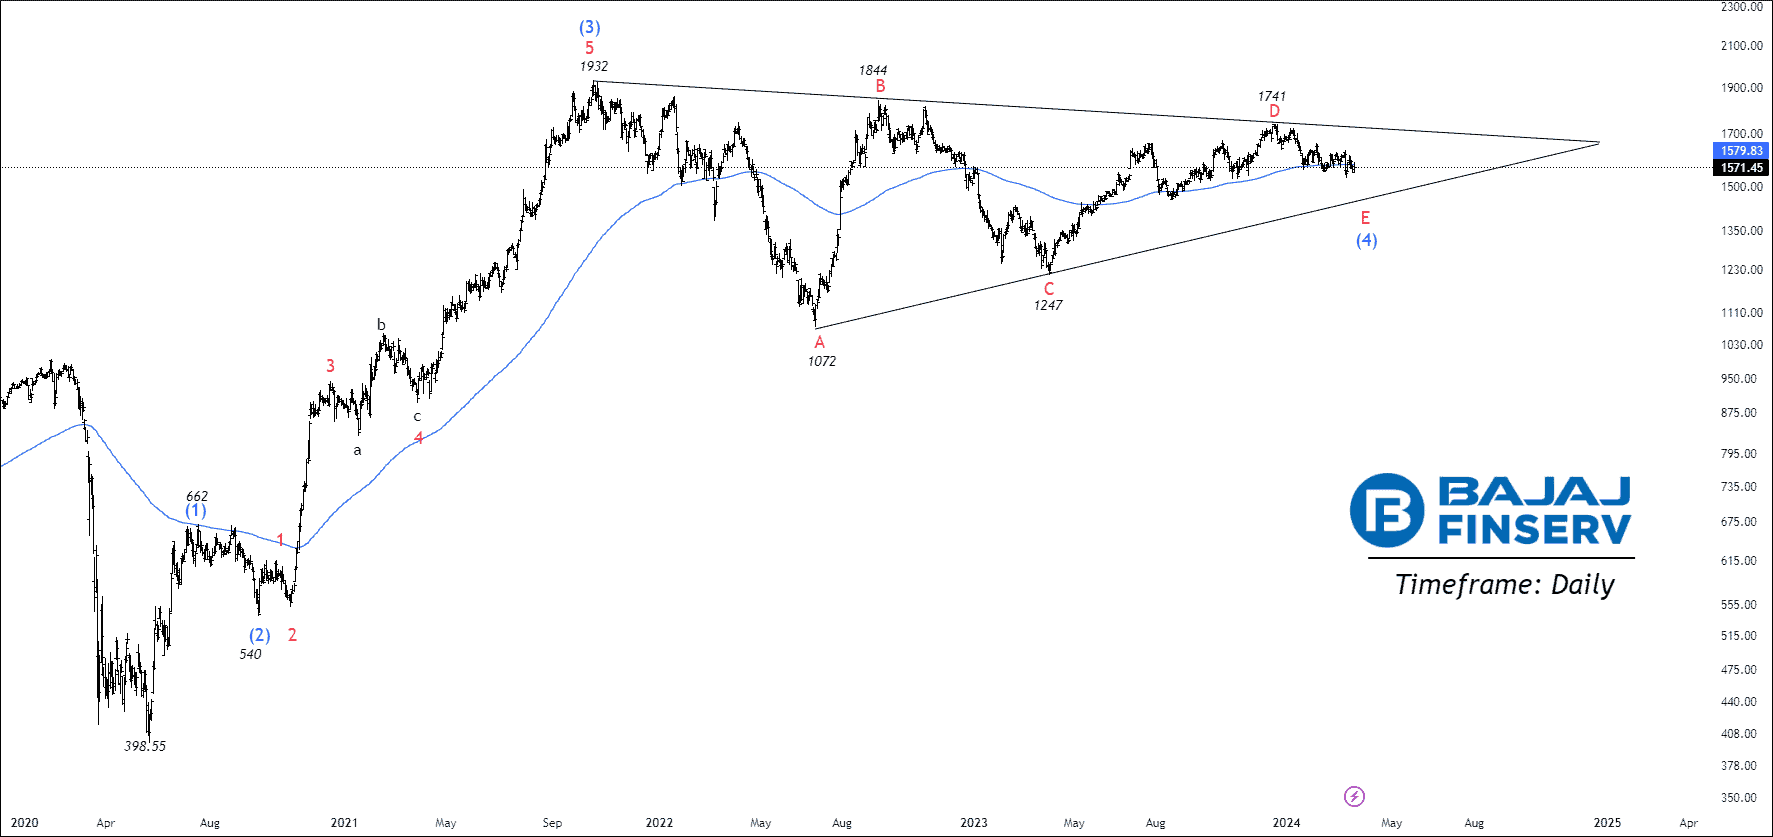
Updated Count – ULTRACEMCO & BAJFINANCE
 Lock
Lock
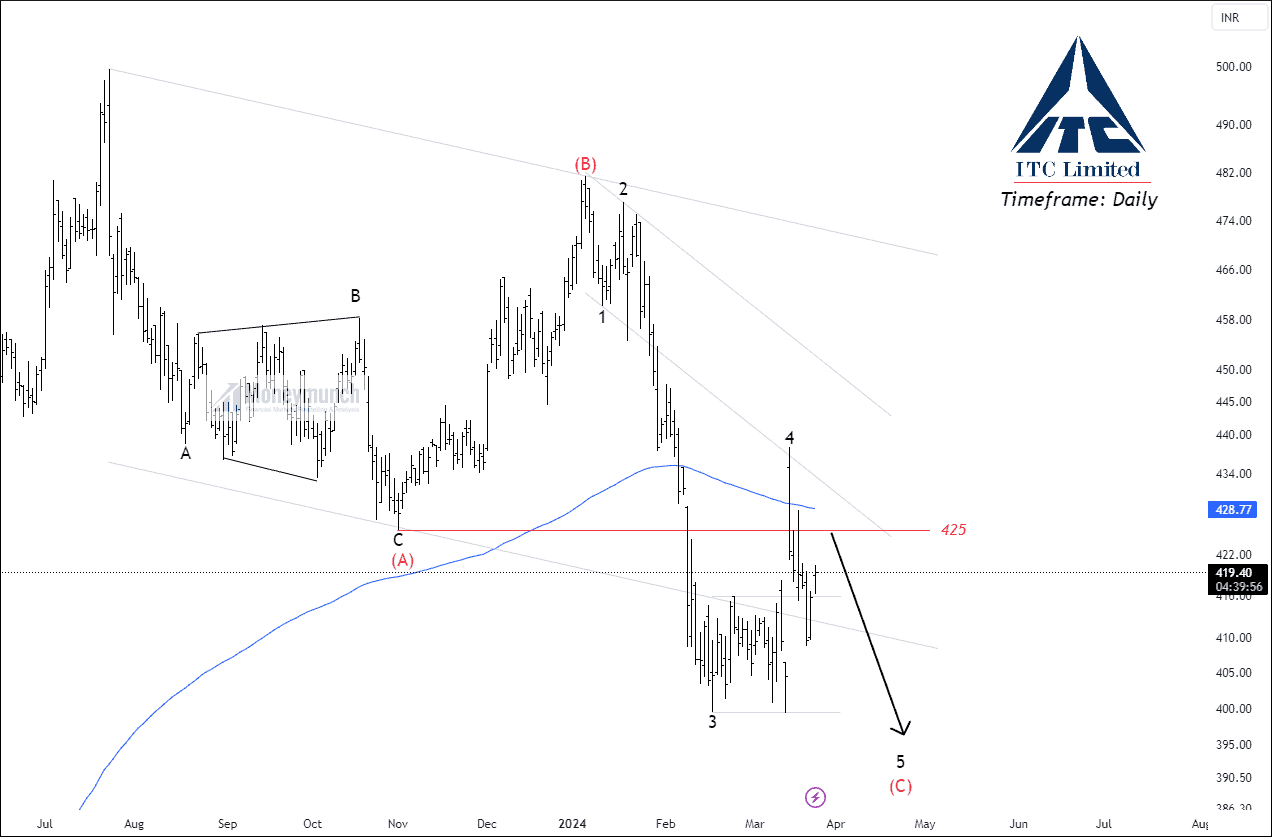
NSE ITC – Elliott Wave Projection
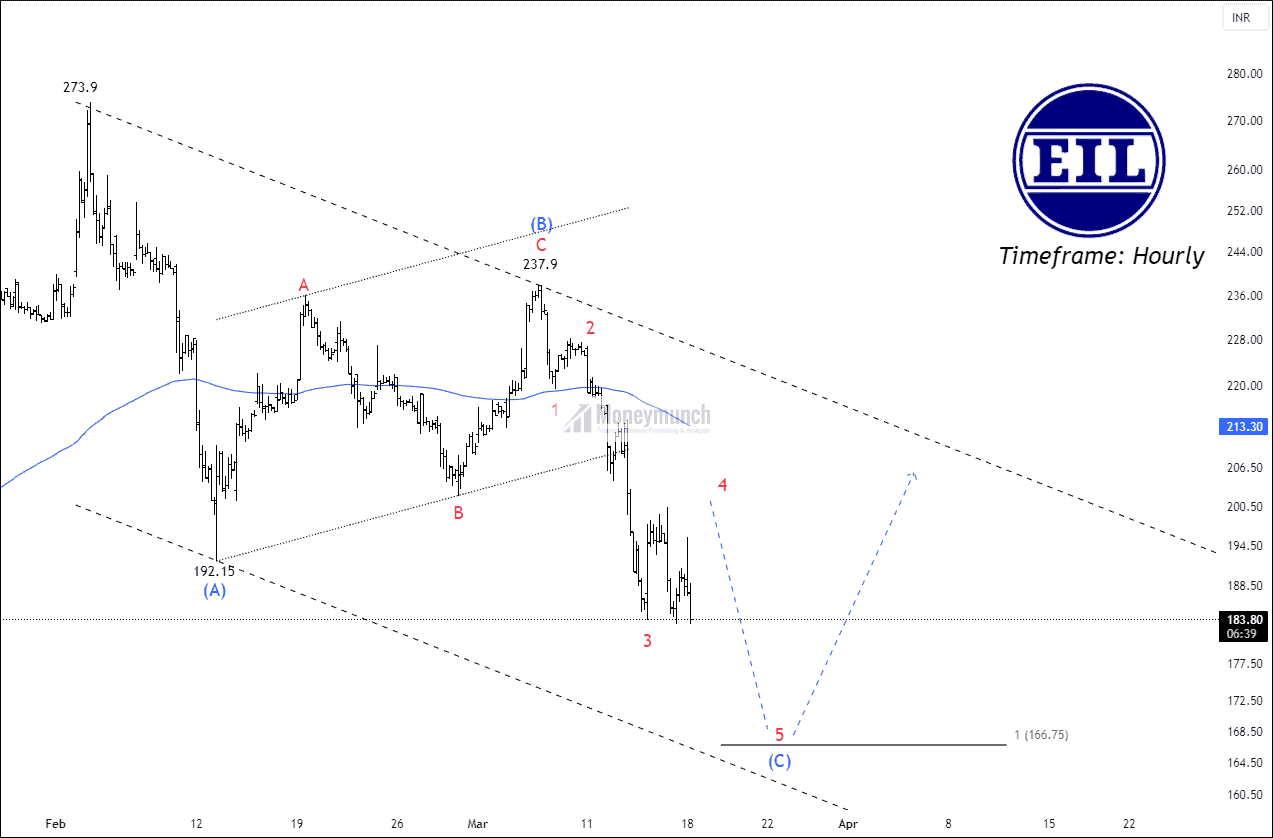
NSE ENGINERSIN – Elliott Wave Projection
NSE BAJAJFINSV Is Preparing for Sub-Wave E of (C)
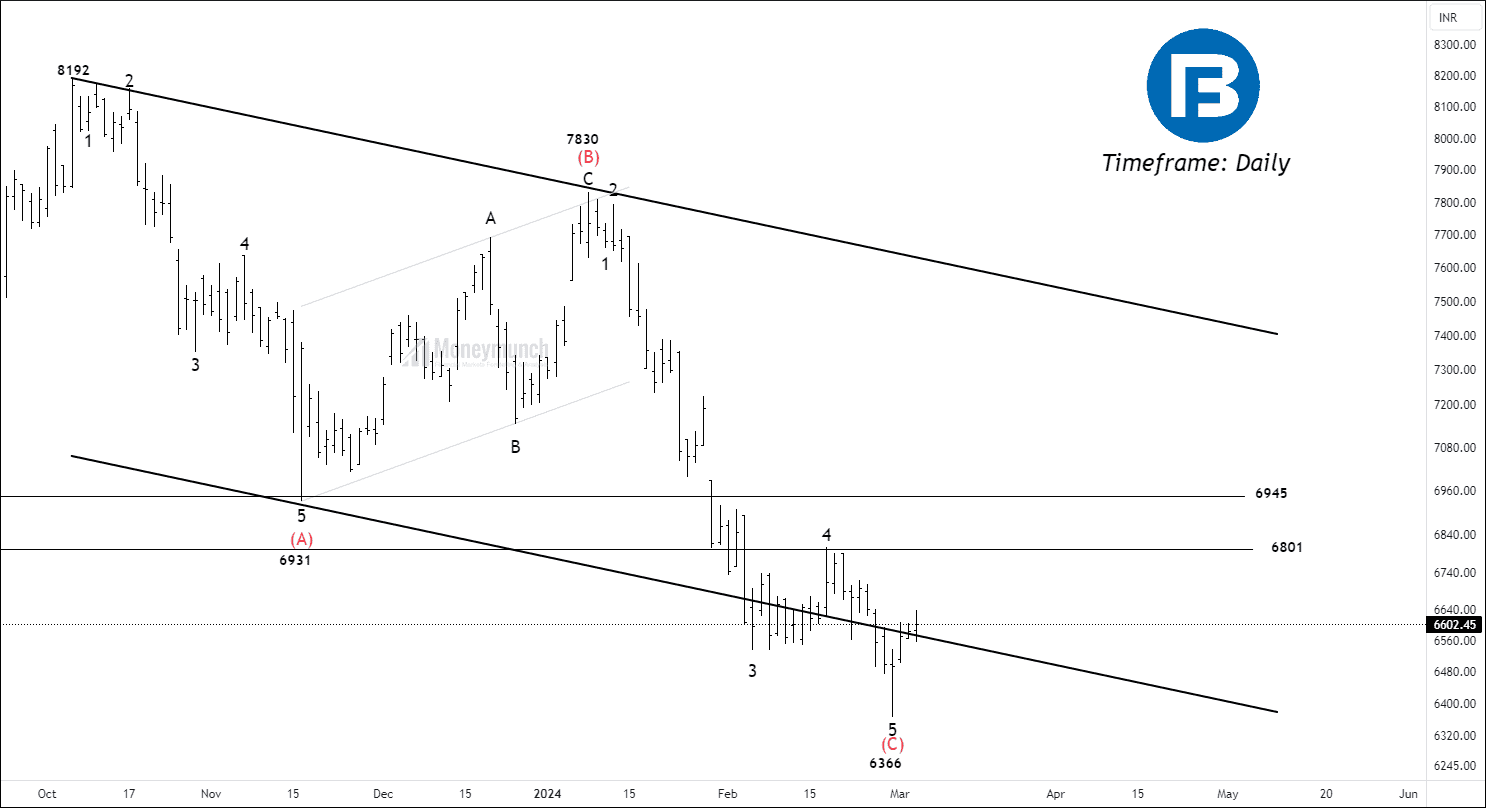
Will NSE HDFCBANK Regain Its Dominance?
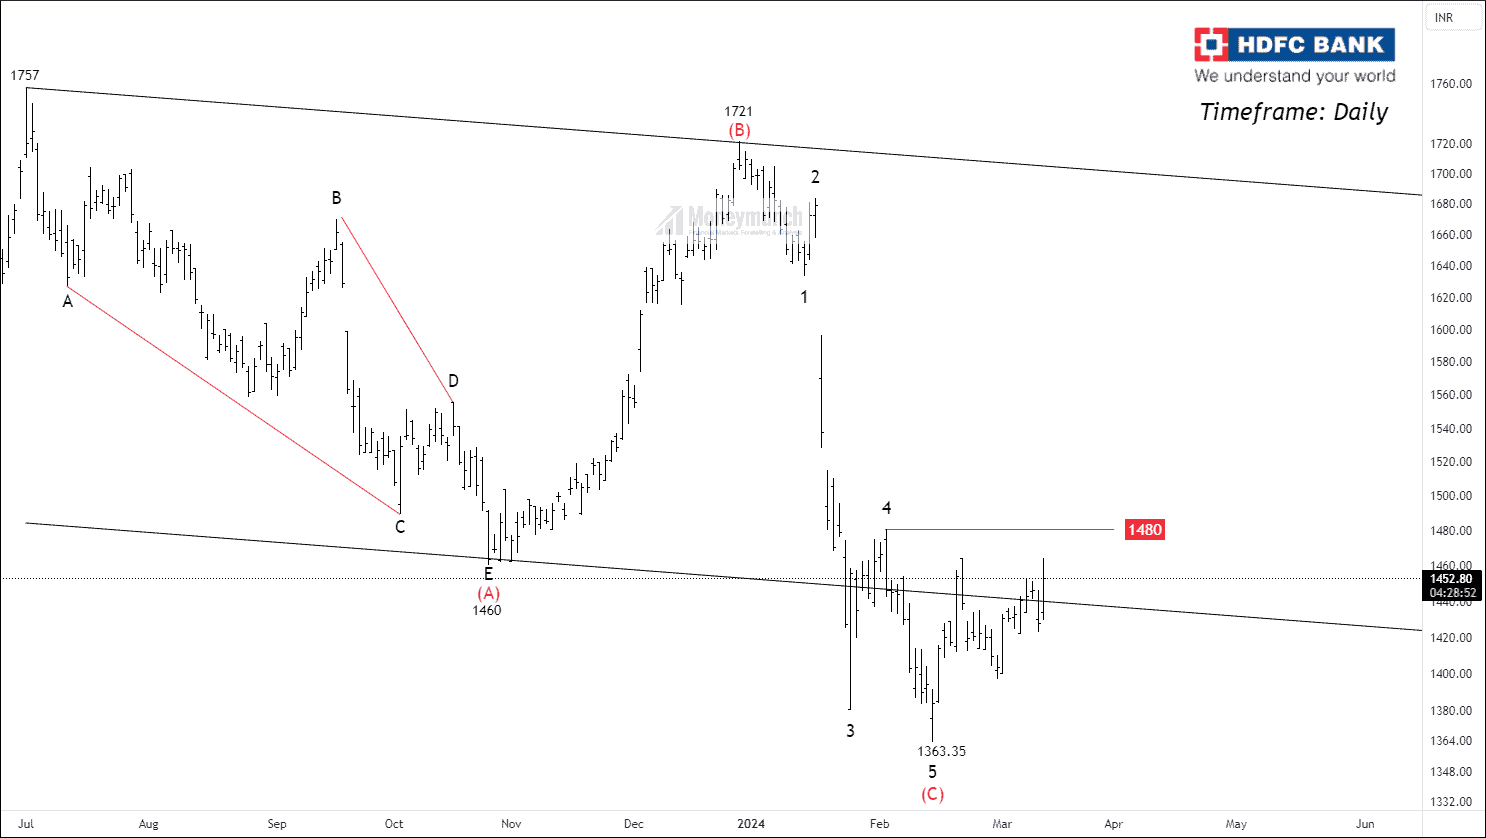
Timeframe: Daily
As per the chart, NSE HDFCBANK has entered the corrective channel after giving a throw-under. The price is resistance from the 35/50 Exponential moving average. The primary issue lies in the decreasing ATR and ADX, as a robust uptrend necessitates a supportive ADX.
Based on the wave principle, HDFC Bank has completed corrective wave (C) at 1363.35. To validate the uptrend structure, the price needs to surpass wave four at 1480. It’s advisable to refrain from entering the market unless there’s a robust breakout of the sub-structure. Targets can be projected up to 1600.
We will update further information soon.Continue reading
HDFCLIFE Is Preparing For Impending Advance But…
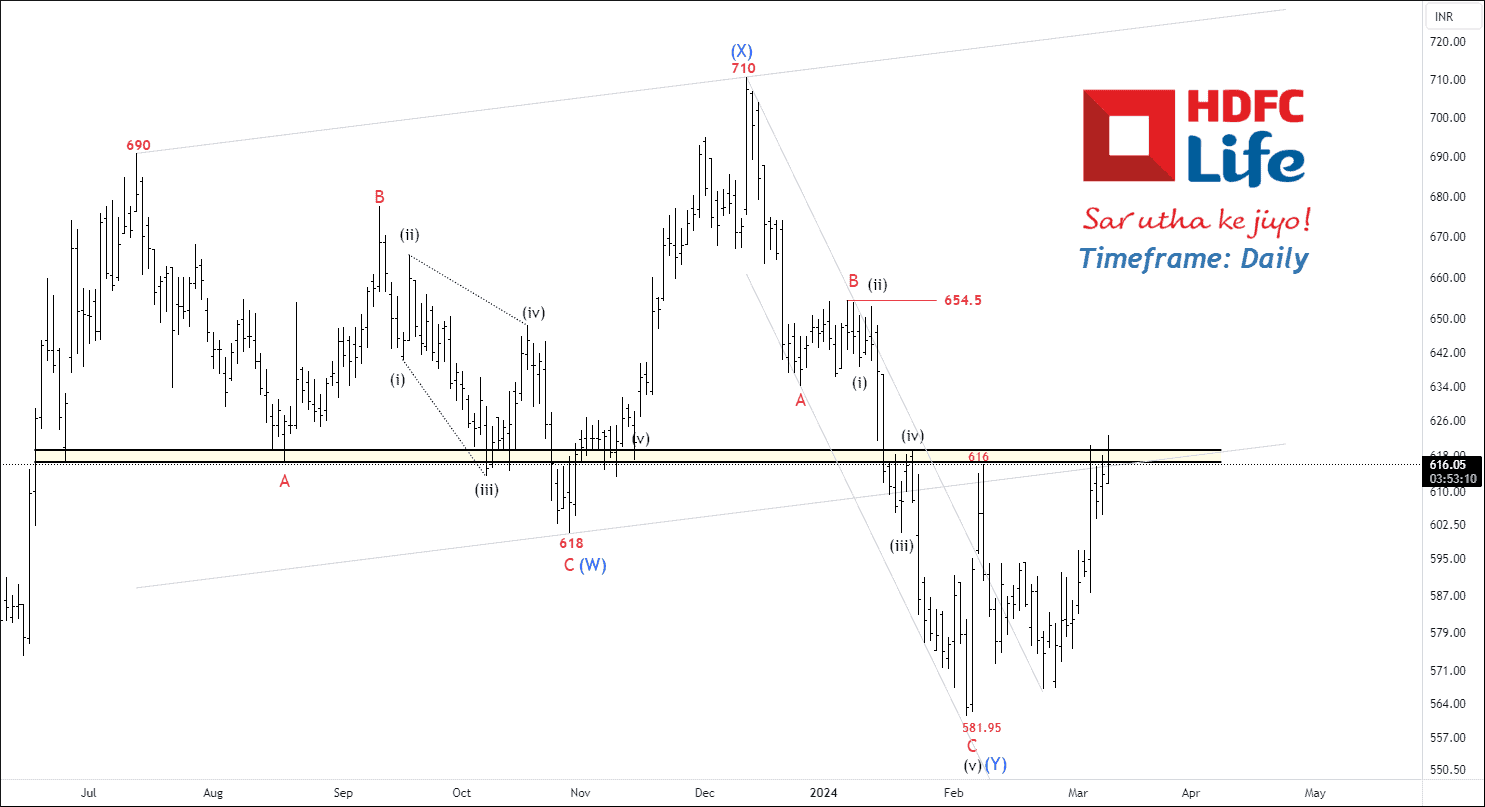
Timeframe: Daily
HDFC Life appears to be undergoing a corrective structure in the form of a W-X-Y pattern, indicative of a flat wave formation. Recent price action has seen the stock breaking above key moving averages, namely the 50, 100, and 200 EMAs. Notably, there’s a significant resistance zone around 620.
The ADX, a measure of trend strength, has climbed to 20, suggesting increasing momentum in the price movement. It’s observed that the impulsive wave (v) of C of (Y) may have reached saturation, hitting a 2.618% extension at 581.95.
Anticipating a potential strong upward move, traders are eyeing targets at 636 – 654 – 690. Targets following a breakout above the long-term resistance zone. However, it’s crucial to acknowledge the significance of this resistance level, as failure to breach it could lead to a retracement towards lower lows.
Stay tuned for further updates on this analysis.Continue reading
NSE COCHINSHIP – Trading Insights & Updates
Did you trade NSE COCHINSHIP trade setup?
Click here: Trade Setup – NSE 3MINDIA, FINEORG & More
We had written clearly, “If the price sustains above 865, traders can trade the following targets: 878– 891– 909+”
Timeline:
[04 March 2024]
- 09:15 AM – NSE COCHINSHIP Made a new low of 864.5, which was our entry point.
- 09:30 AM – Price touched the first target of 878.
- 09:45 AM – Security price reached the final target of 909, and made a new high of 913.8.
Only Premium subscribers will receive trade setups on our mobile application.Continue reading
NSE INFY – Bears Destroyed the Whereabouts of Bulls
Did you trade NSE INFY trade setup?
Click here: Trade Setup – NSE BAJAJFINANCE & INFY
We had written clearly, “Sustained trading below 1647 could indicate further downside potential. Traders may consider the following targets: 1635 – 1622 – 1605+”
Timeline:
[05 March 2024]
- 11:45 AM – NSE INFY hit the Final target of 1605, and made a new low of 1602.
[06 March 2024]
- 10:45 AM – Price made a new low of 1580.10.
We will keep sharing this type of setup for premium subscribers only.Continue reading
Trade Setup – NSE BAJAJFINANCE & INFY
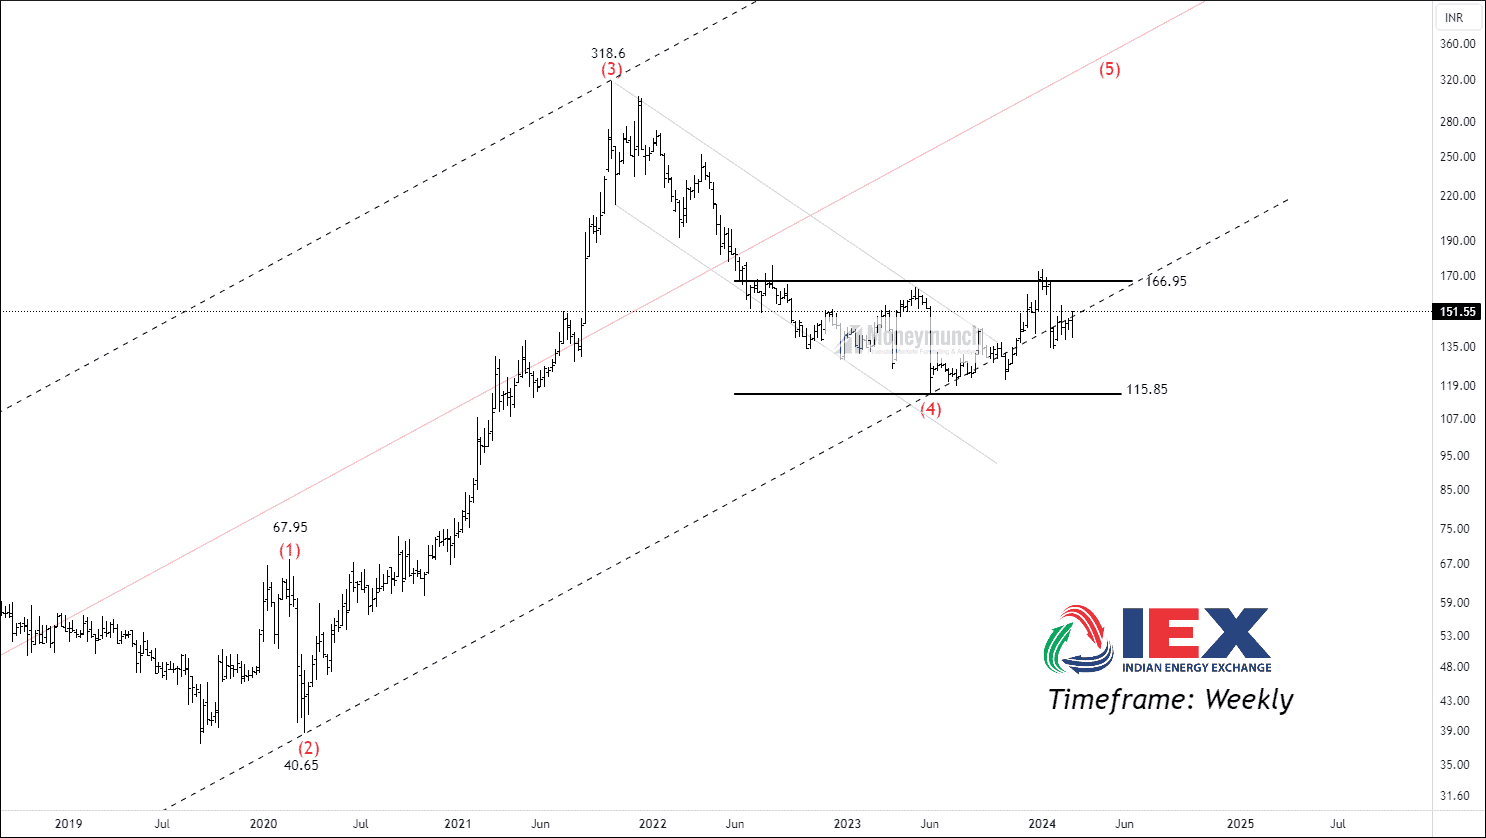
NSE IEX – Elliott Wave Projection
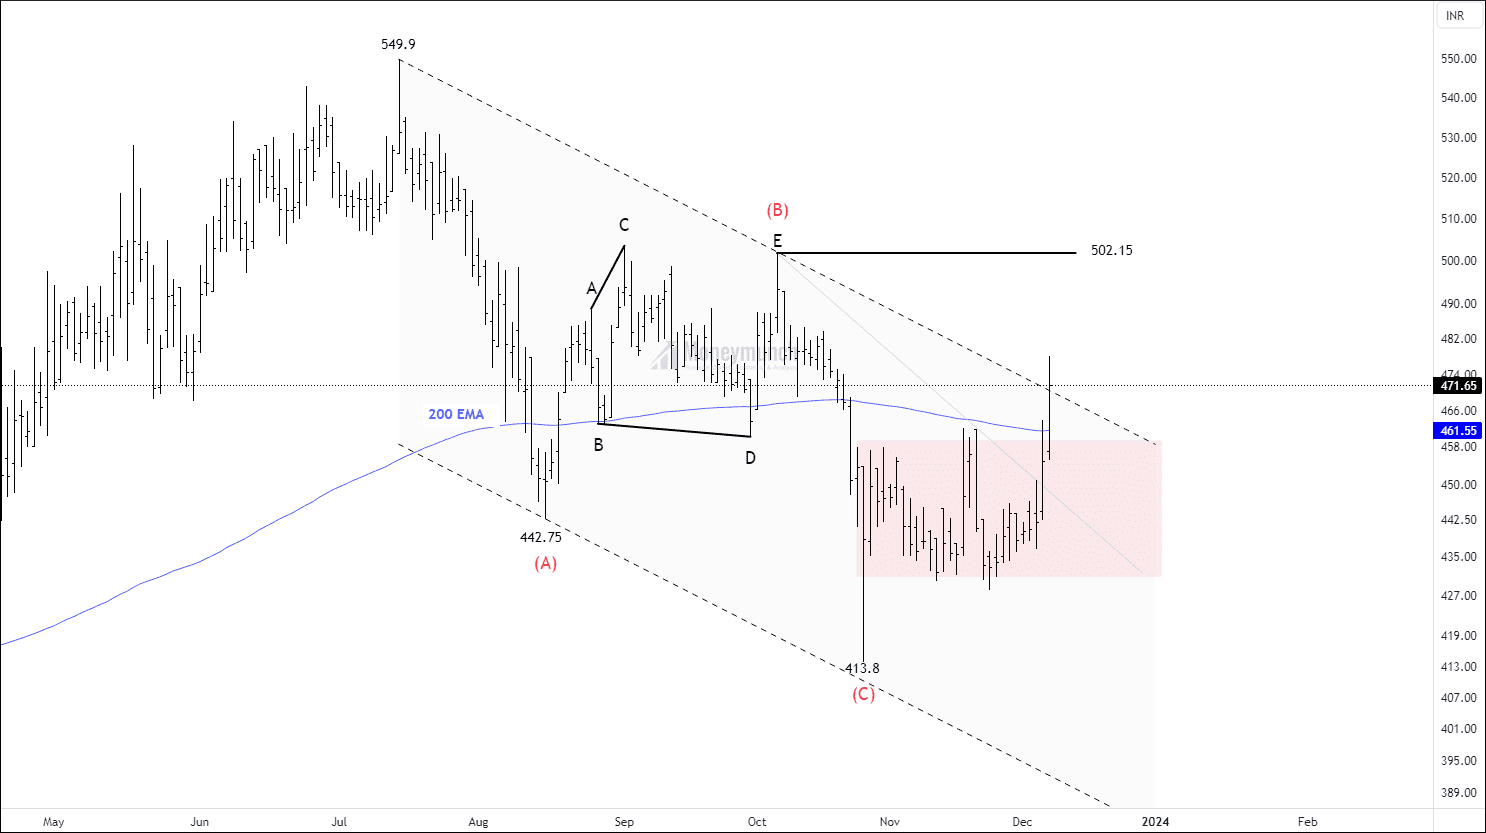
NSE EIHAHOTELS Achieves a Triumphant 76% Gain
Did you trade remember NSE EIHAHOTELS Wave setup?
Click here: NSE SBICARD & EIHAHOTELS – Trade Setup
 BEFORE
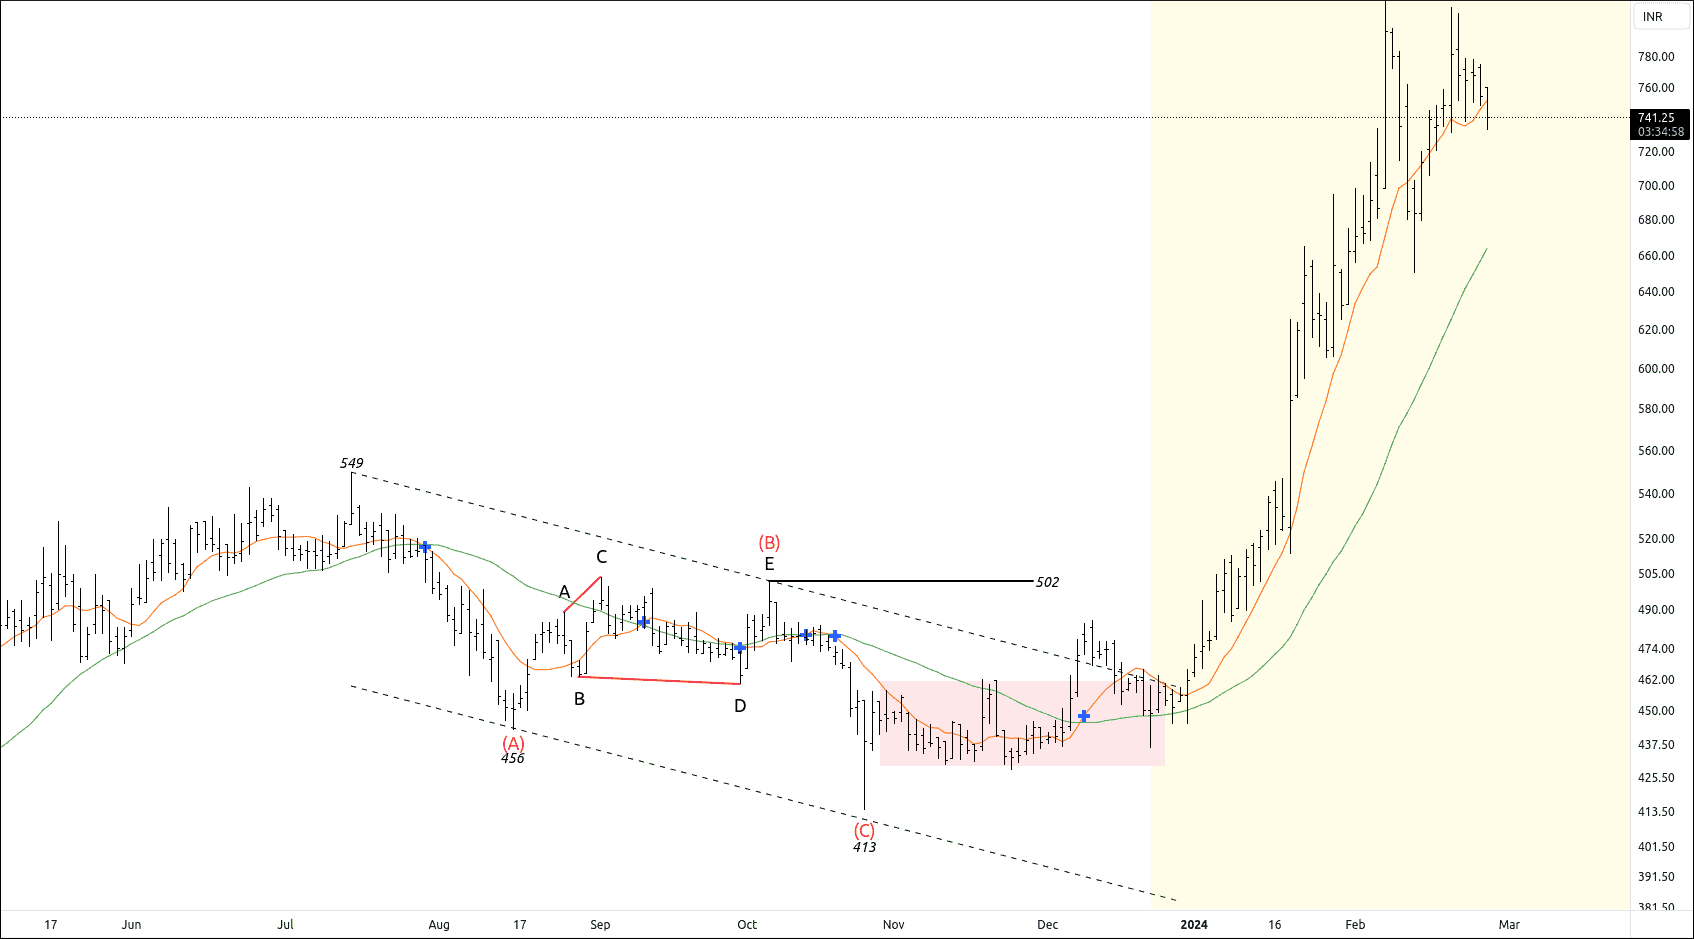
We had written clearly, “If the price breaks out and sustains above the corrective channel, traders can trade for the following targets: 502 – 524 – 542+”
 AFTER
AFTER
Timeline:
[5 January 2024]
- 09:15 AM – Price touched the first target of 502.
[16 January 2024]
- 10:45 PM – EIHAHOTELS hit the first target of 524.
[18 January 2024]
- 01:45 PM – Price Achieved the final target of 542, and made a new high of 625.
[7 February 2024]
- 09:15 AM – NSE EIHAHOTELS made a new high of 818.95.
This Wave setup has given more than 76% return within 2 months.
We will update more Wave setups soon.
Trade Setup – NSE 3MINDIA, FINEORG & More
NSE 3MINDIA – Breakout Setup
3MINDIA reached a peak of 39876 before experiencing a significant decline of 24.16% within a span of two months. Although the price has remained above the 10-day moving average, it hasn’t surpassed the 35 and 50-day moving averages. The ADX (Average Directional Index) has dropped to 15.
The sub-wave 4 structure of 3MINDIA has been breached, signaling a potential opportunity for traders. However, it’s crucial for traders to confirm any pullback and entry after ensuring sustainability. If the price manages to sustain itself above 31500, traders may consider initiating trades with the following targets: 32425 – 33079 – 33600+. Free subscribers can take the previous day’s low as an invalidation level.
Trade setup with entry, exit, and invalidation at the exact time is only available for premium subscribers.
NSE COCHINSHIP – Resistance Breakout
NSE COCHINSHIP has been trading above 10 & 35 crosses over and above 50 simple moving averages. ADX of the price has reached to 17. RSI of the at 58.
NSE COCHINSHIP has broken out the resistance level of 865. If the price sustains above 865, traders can trade the following targets: 878 – 891 – 909+. Traders can take the previous day as an invalidation level.
We will update further information for premium members soon.Continue reading
NSE BANKNIFTY & FINNIFTY – Elliott Wave Projection
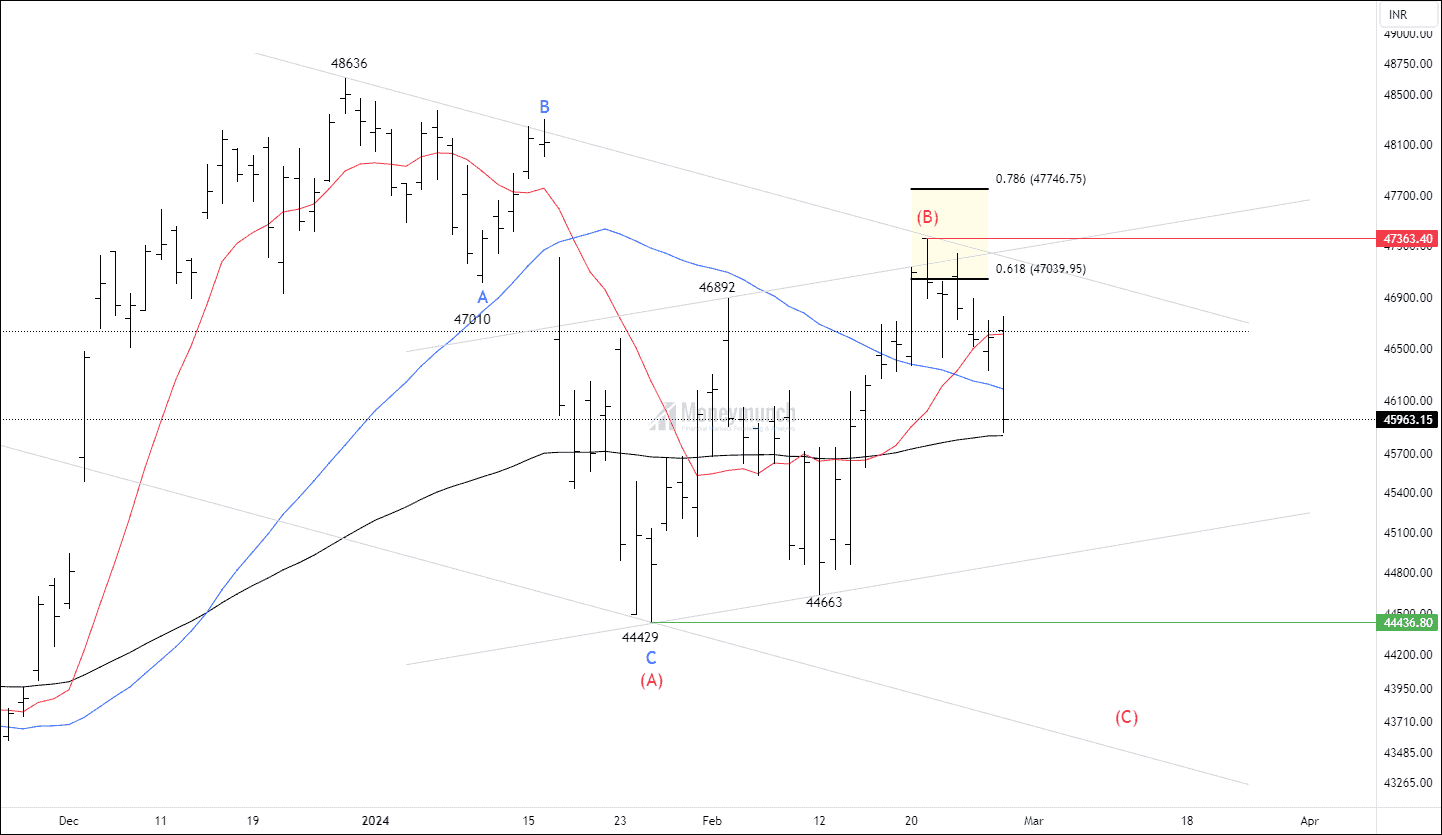
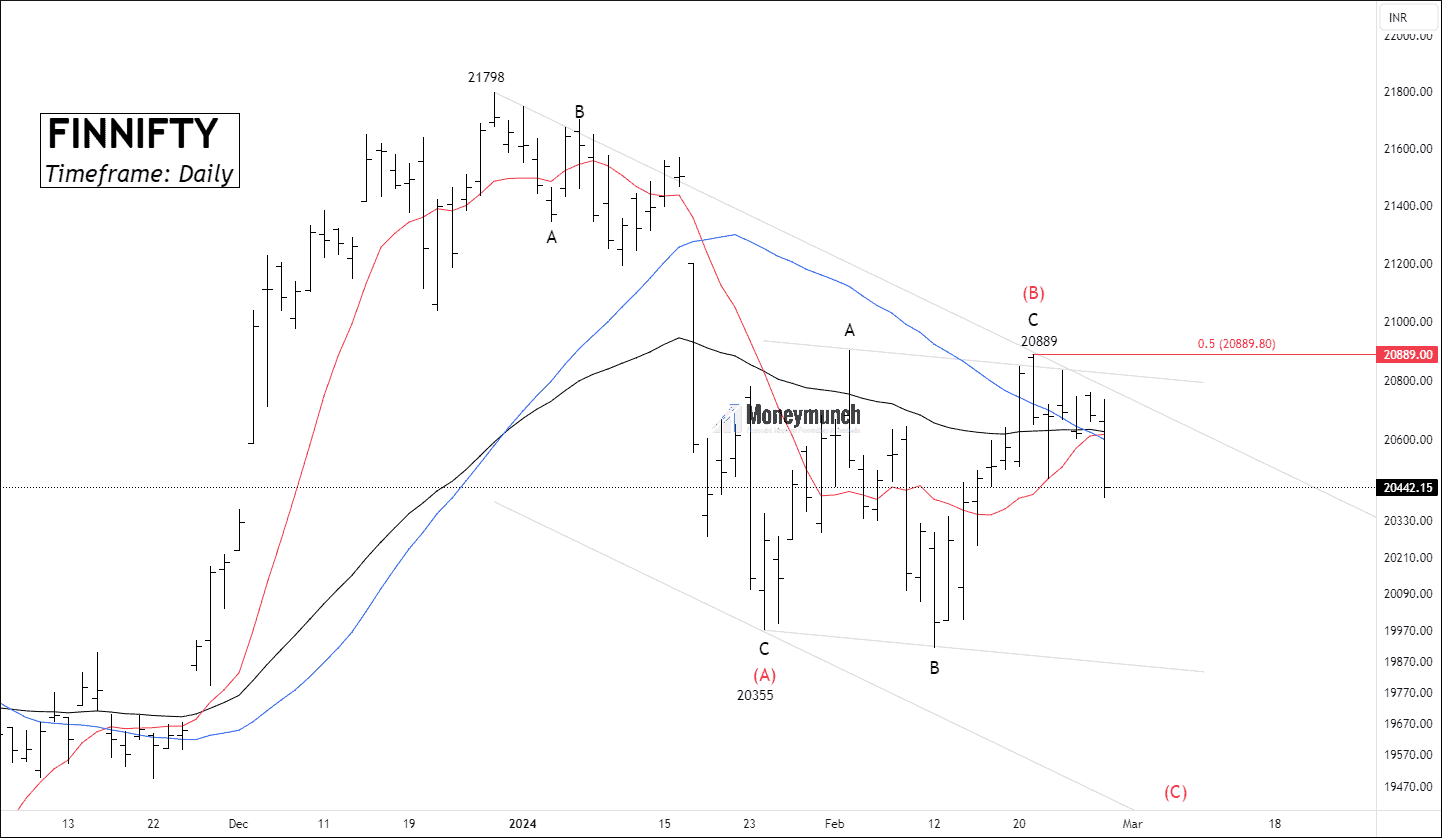
Timeframe: Daily
The bank nifty spot has broken down 10/35/50 Moving average and trading at 100 Exponential moving average that spots weakness. From the low of 44429 to the high of 47363, the ADX of the price fell to 15.92.
According to Elliott Wave, the current structure can be labeled A-B-C correction. It’s acceptable to expect a flat as wave B retraced 78.6%.
Alert bulls! There are only two opportunities:
(1) At the lower band after completion of wave C.
(2) Only after the breakout of wave (B).
Wave C can occur near wave the low of (C). sellers can extend targets after the aggressive breakdown of wave C. If the price is falling and reaching too far from the breakdown place, the move can be reliable as an impulsive.
Trade setup with entry, exit, and invalidation is only available for premium subscribers.
 Continue reading
LuxmaTech: NSE’s Bear-Slaying Titan
Do you remember the NSE LUMAXTECH Wave setup?
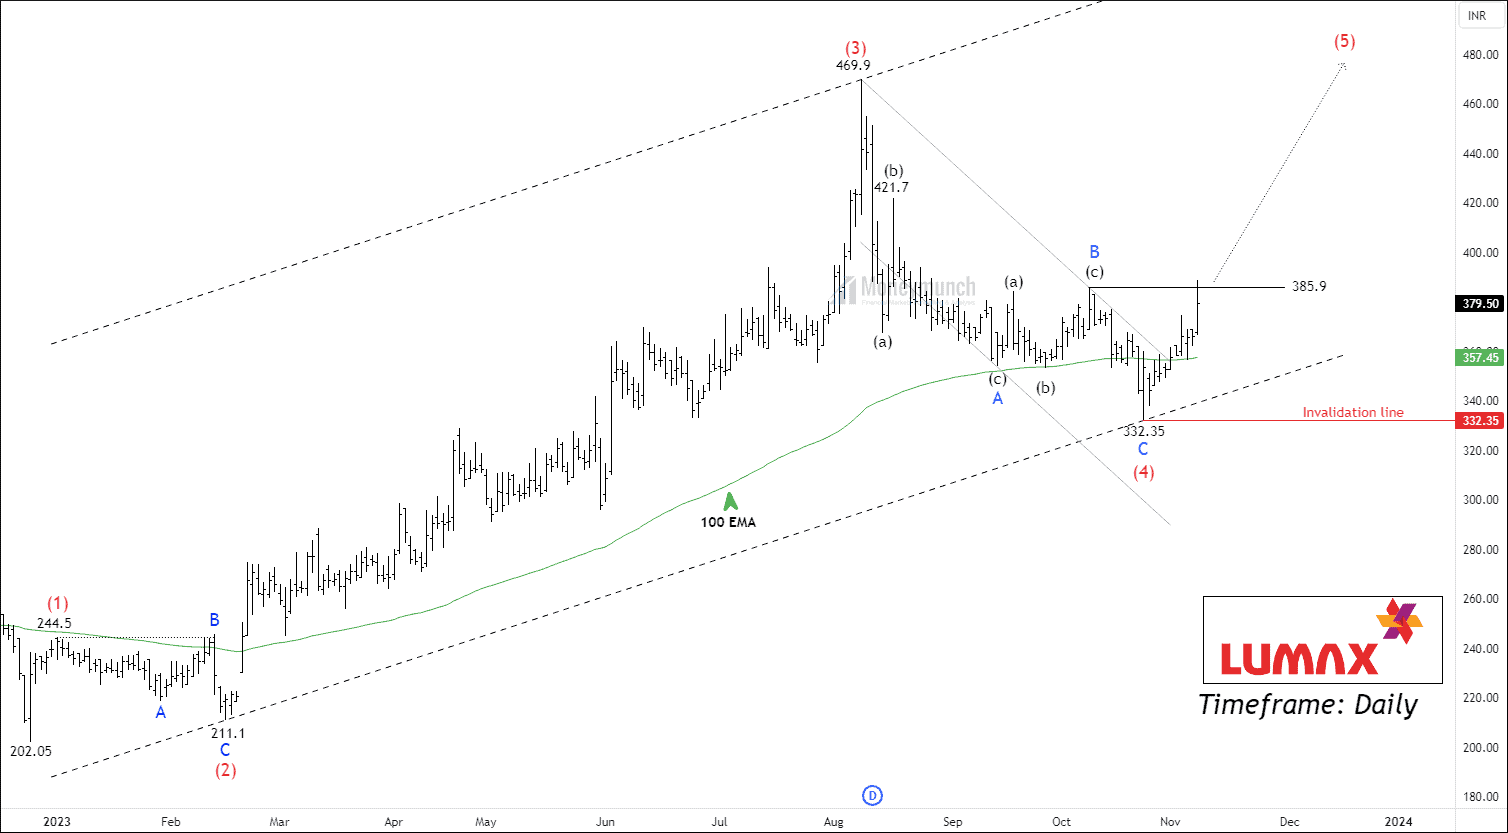
Click here: NSE LUMAXTECH – Elliott Wave Count
 BEFORE
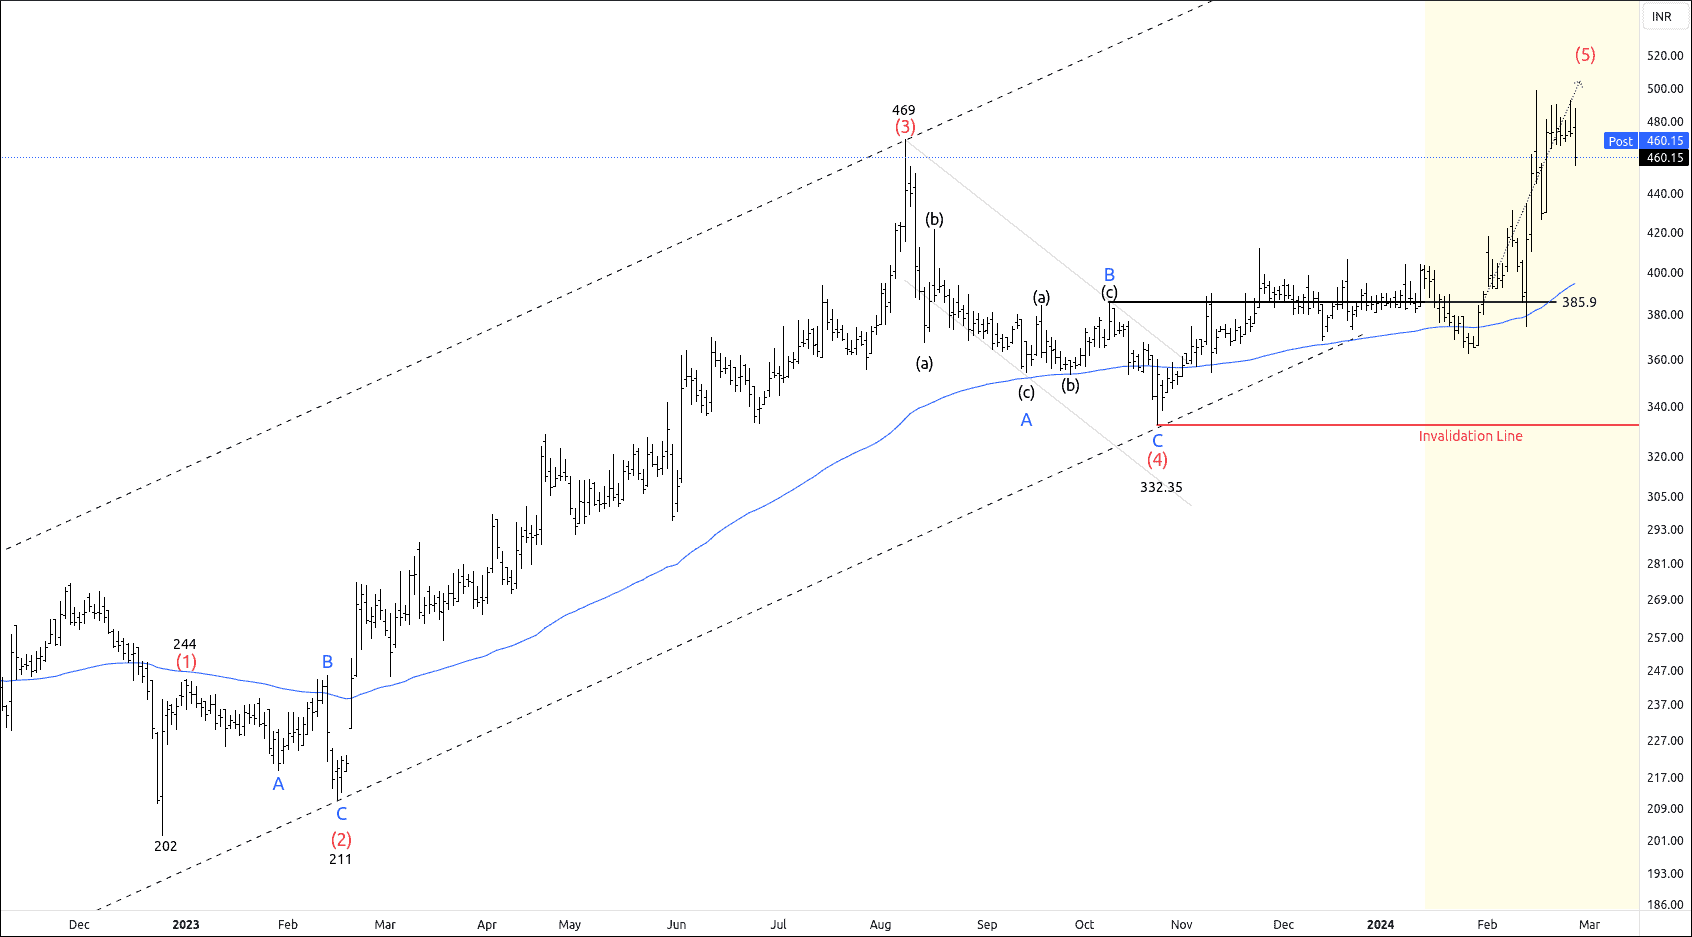
We had written clearly, “Should the price surpass the wave B level at 385.9, traders may consider taking positions with the following price targets: 405 – 421 – 448+”
 AFTER
AFTER
Timeline:
[1 February 2024]
- 09:15 AM – Price touched the first target of 405, and made a new high of 418.
[08 February 2024]
- 09:30 AM – LUMAXTECH hit the second target of 421, and made a new high of 431.
[14 February 2024]
- 12:30 PM – Price achieved the final target of 448.
[15 February 2024]
- 10:15 AM – NSE LUMAXTECH made a new high of 498.
This Setup could generate returns exceeding 28% in just one month.Continue reading
NSE TREGA Witnesses Bullish Run with a 42% Surge
Do you remember the NSE TEGA Wave setup?
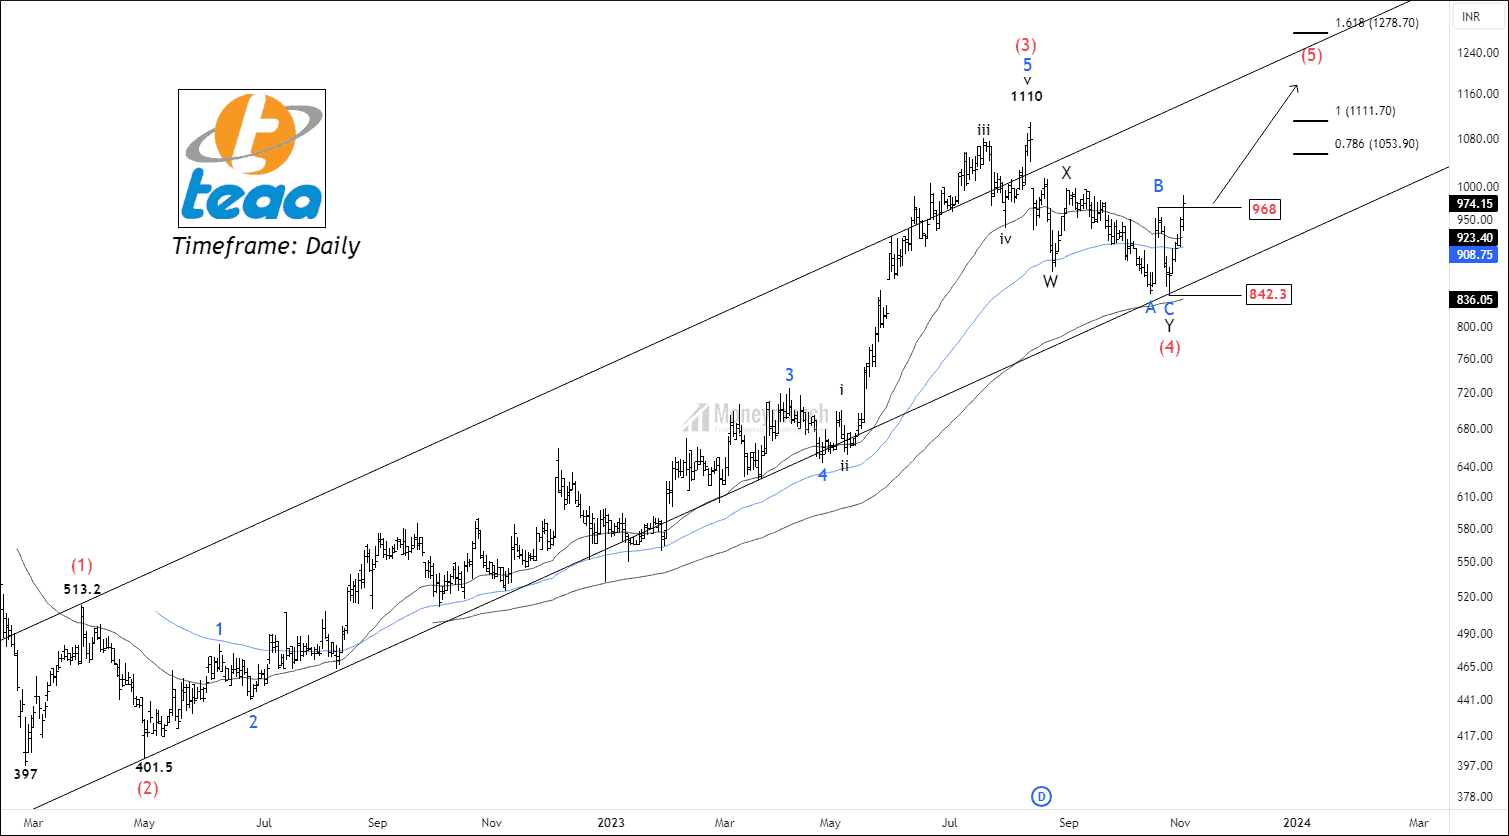
Click here: NSE TEGA – Elliott Wave Projection
 BEFORE
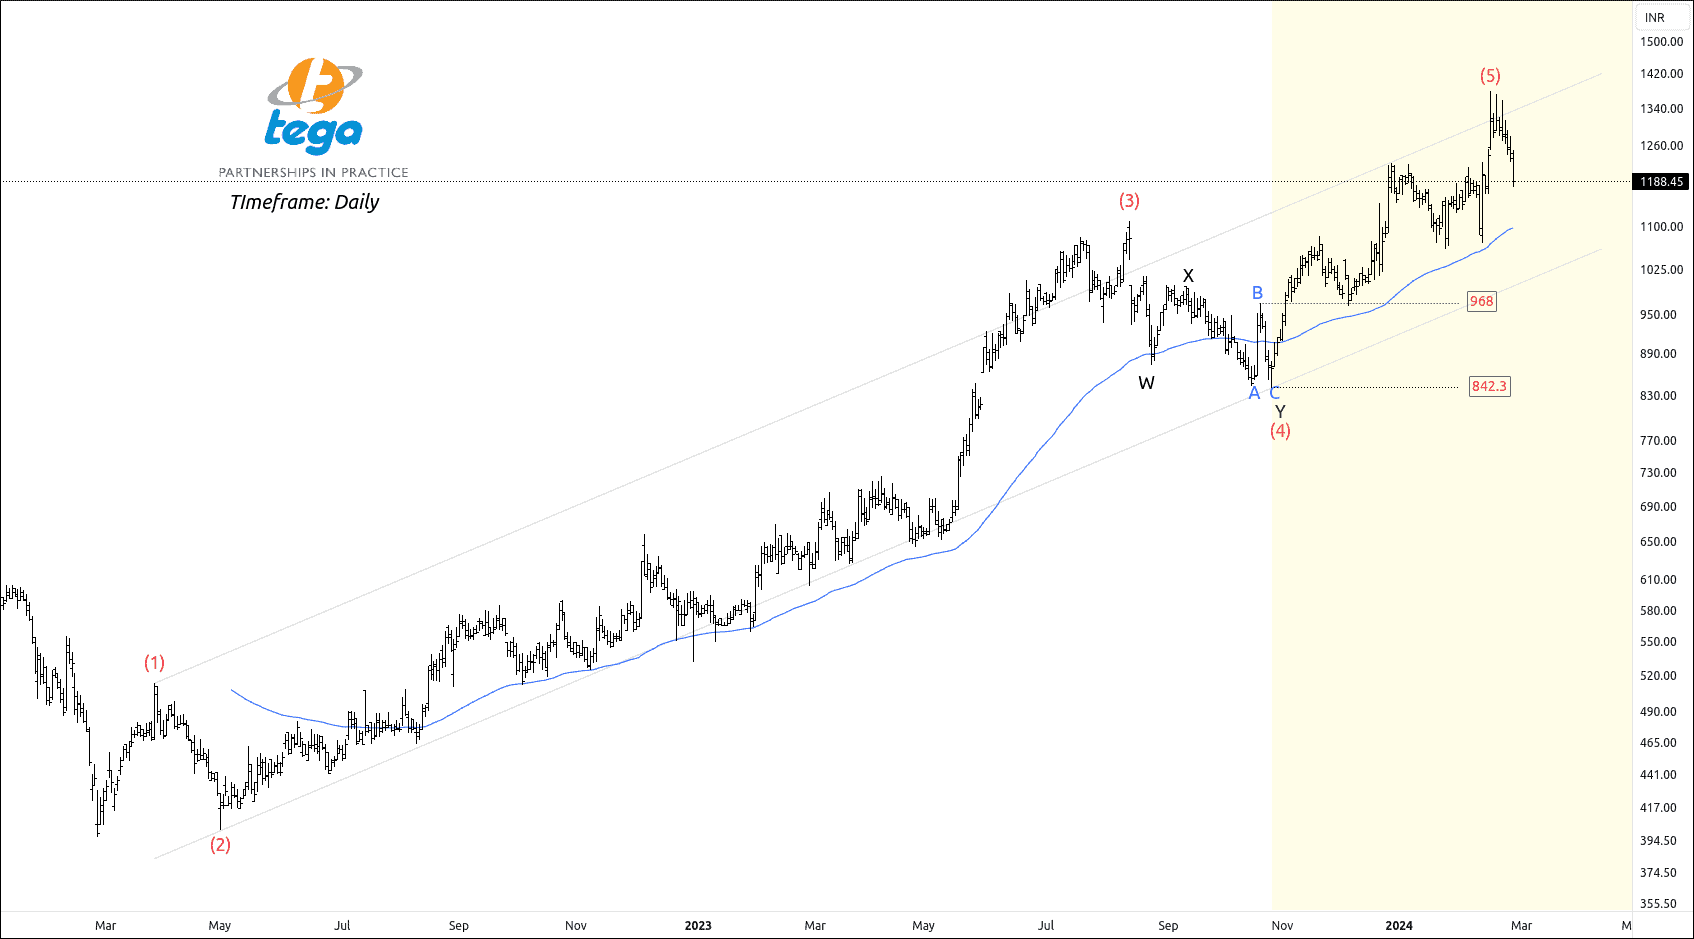
We had written clearly, “If price wave Wave B at 968, traders can buy for the following targets: 1055 – 1171 – 1270+”
 AFTER
AFTER
Timeline:
[15 November 2023]
- 09:15 AM – Price touched the first target of 1055.
[26 December 2023]
- 11:00 AM – NSE TEGA hit the second target of 1171.
[15 February 2024]
- 09:15 AM – Price achieved the final target of 1270, and made a new high of 1380.
This Setup could generate returns exceeding 42% in just 15 weeks.Continue reading
IS MCX Natural gas is Preparing for A Skyrocket?
NSE VOLTAS – Buyers Crushed the Sellers
Did you trade remember NSE VOLTAS Wave setup?
Click here: NSE VOLTAS Is Getting Ready For The Last Move (C)
 BEFORE
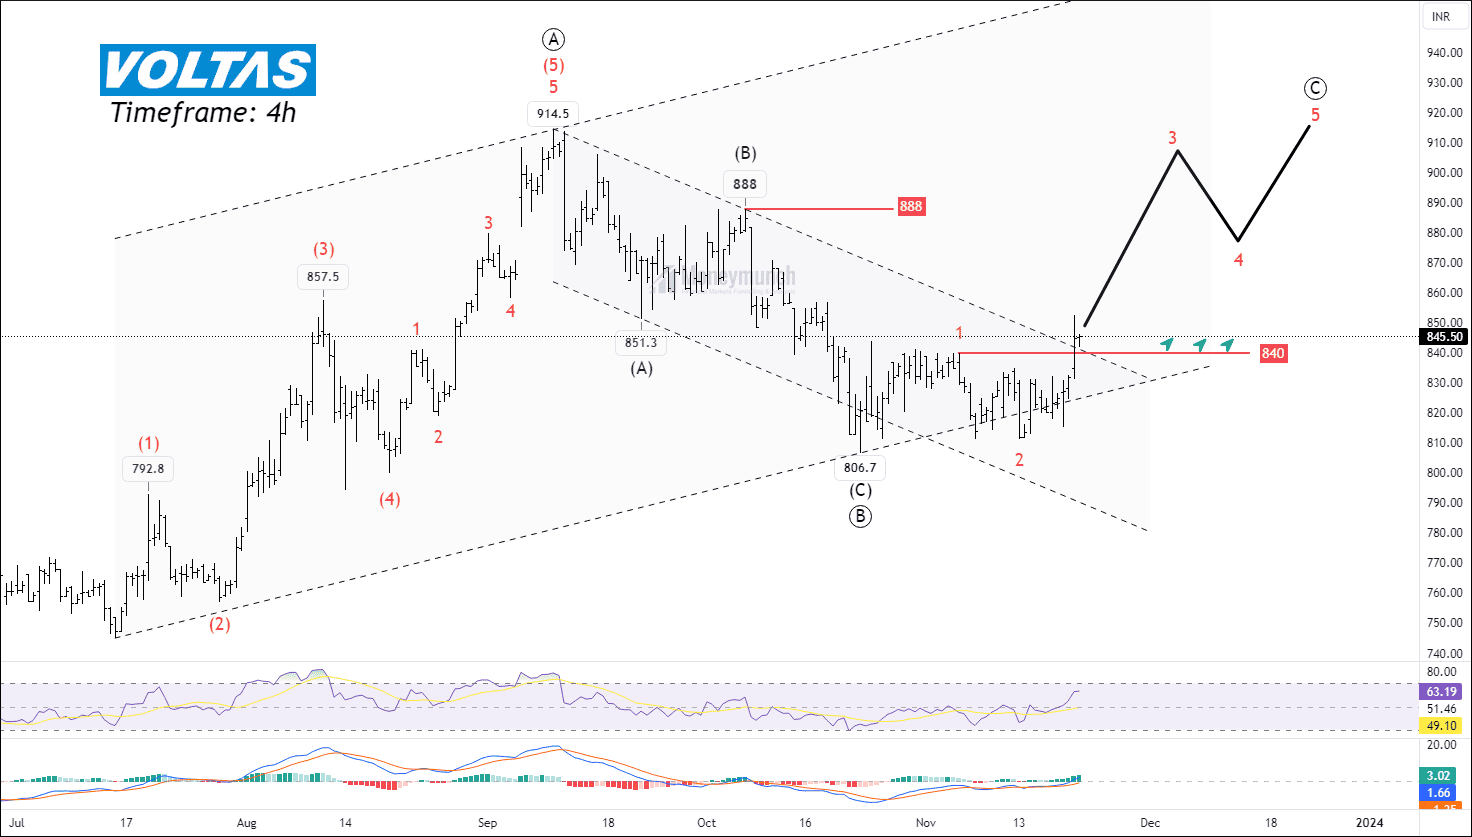
We had written clearly, “Should the price maintain levels above 840, traders may consider buying with the following targets: 860 – 880 – 904+”
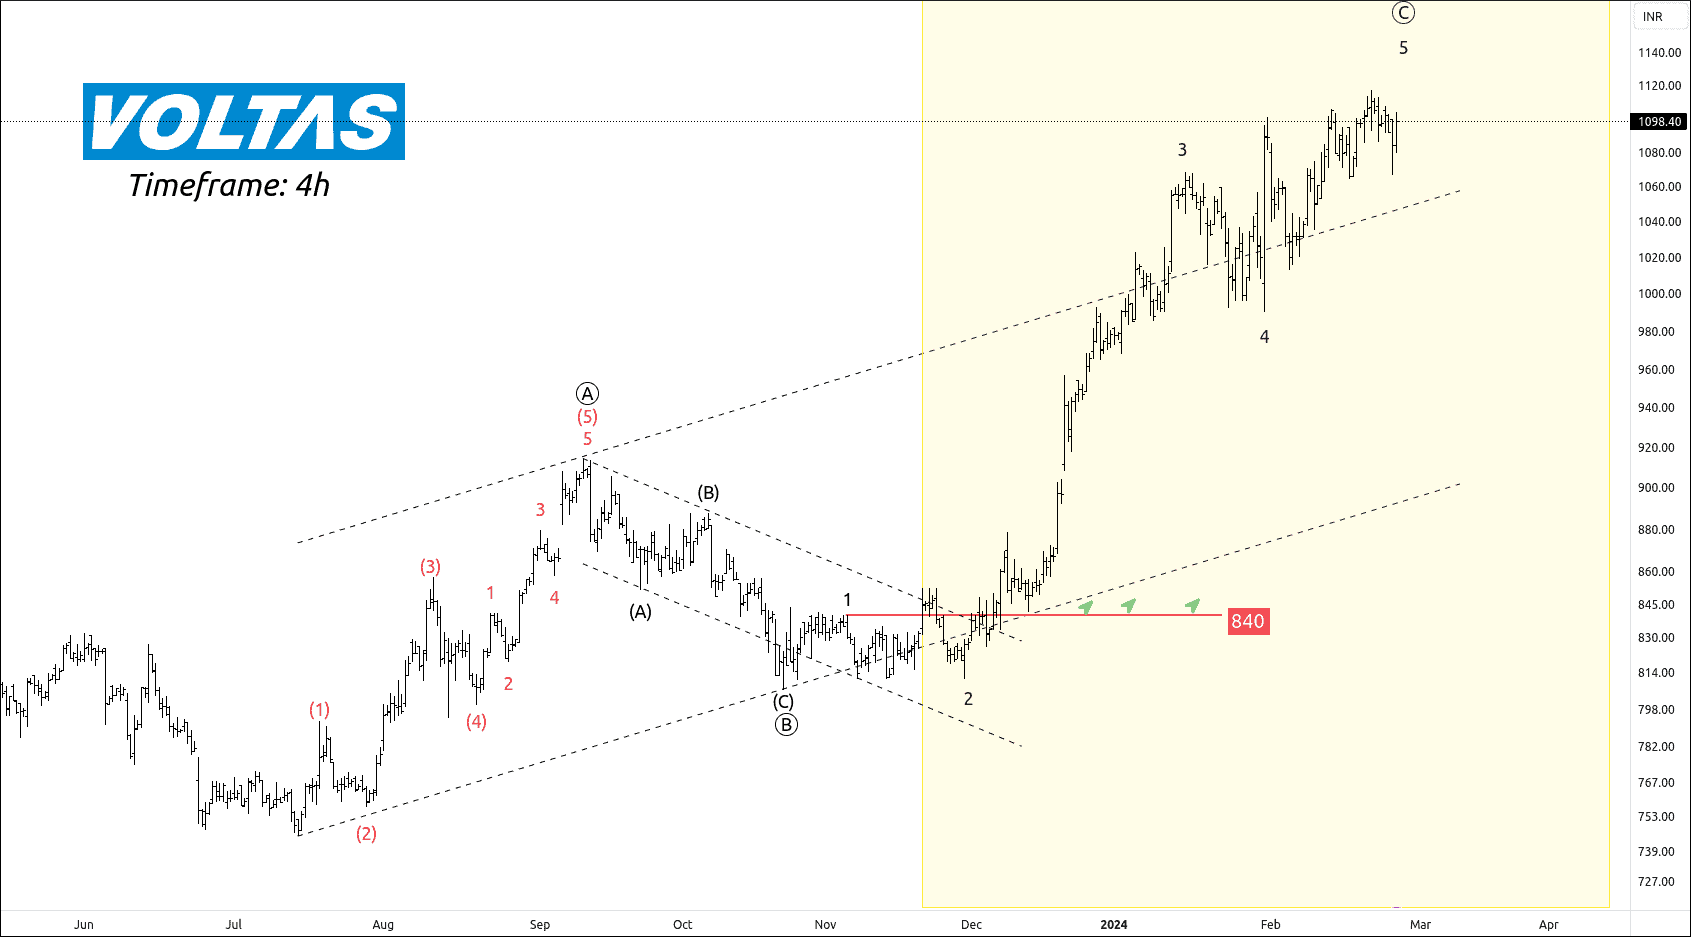 AFTER
AFTER
Timeline:
[08 December 2023]
- 09:45 AM – NSE IDFC Touched the first target of 860.
[19 December 2023]
- 10:30 AM – Price hit the second target of 880.
[20 December 2023]
- 09:15 AM – NSE VOLTAS hit our final target of 904.
[15 January 2024]
- 12:15 PM – Price made a high of 1068.
[21 February 2024]
- 09:15 AM – NSE VOLTAS made a new high of 1117.
This Wave setup has given more than 32% return within 3 months.
We will update more Wave setups soon.
Trade Setup – NSE APOLLOHOSP & GLS
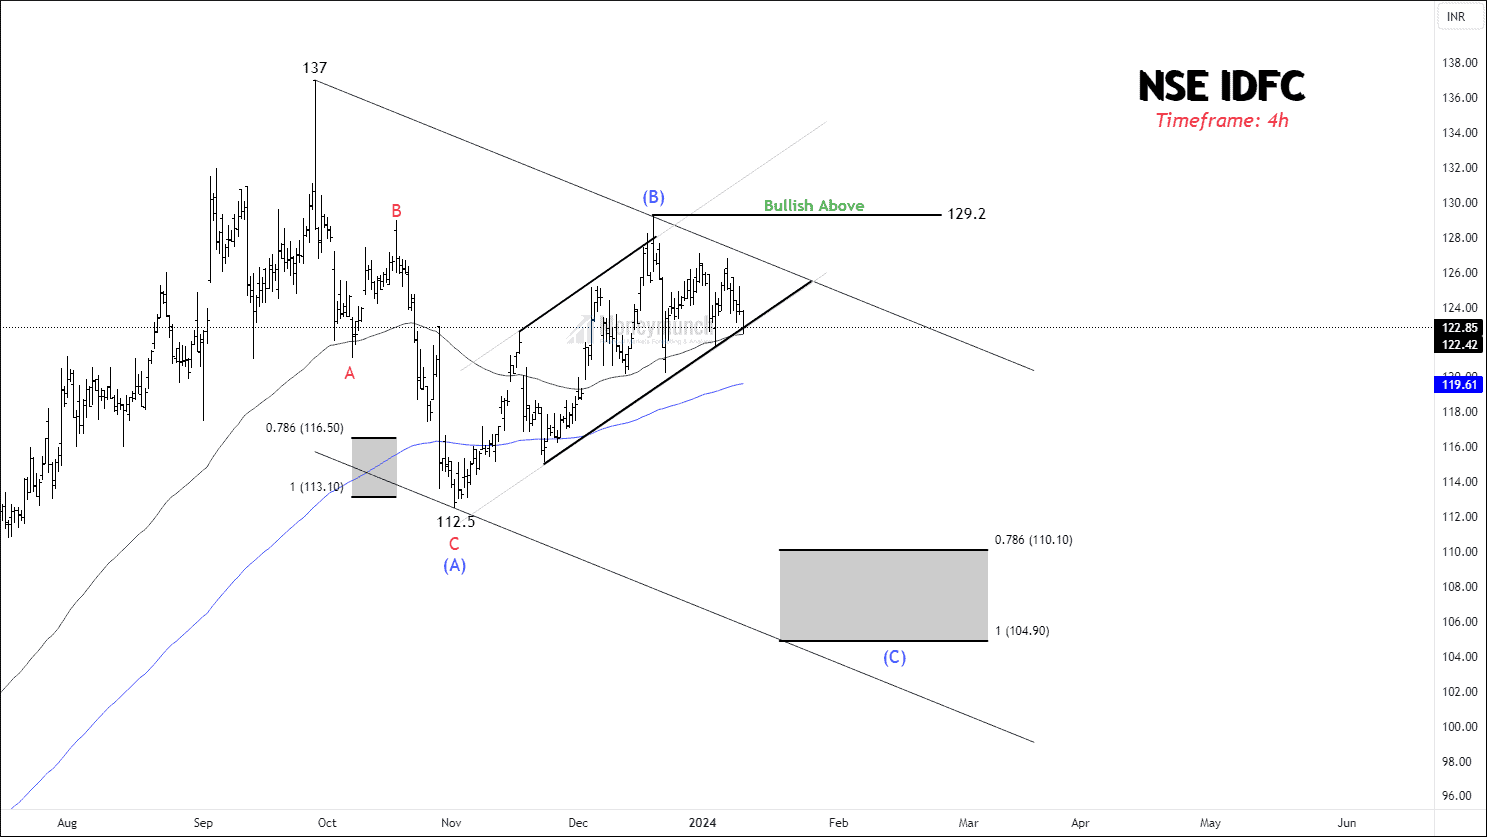
NSE IDFC – Bear Victory
Did you trade NSE IDFC Wave setup?
Click here: NSE IDFC – Elliott Wave Projection
 BEFORE
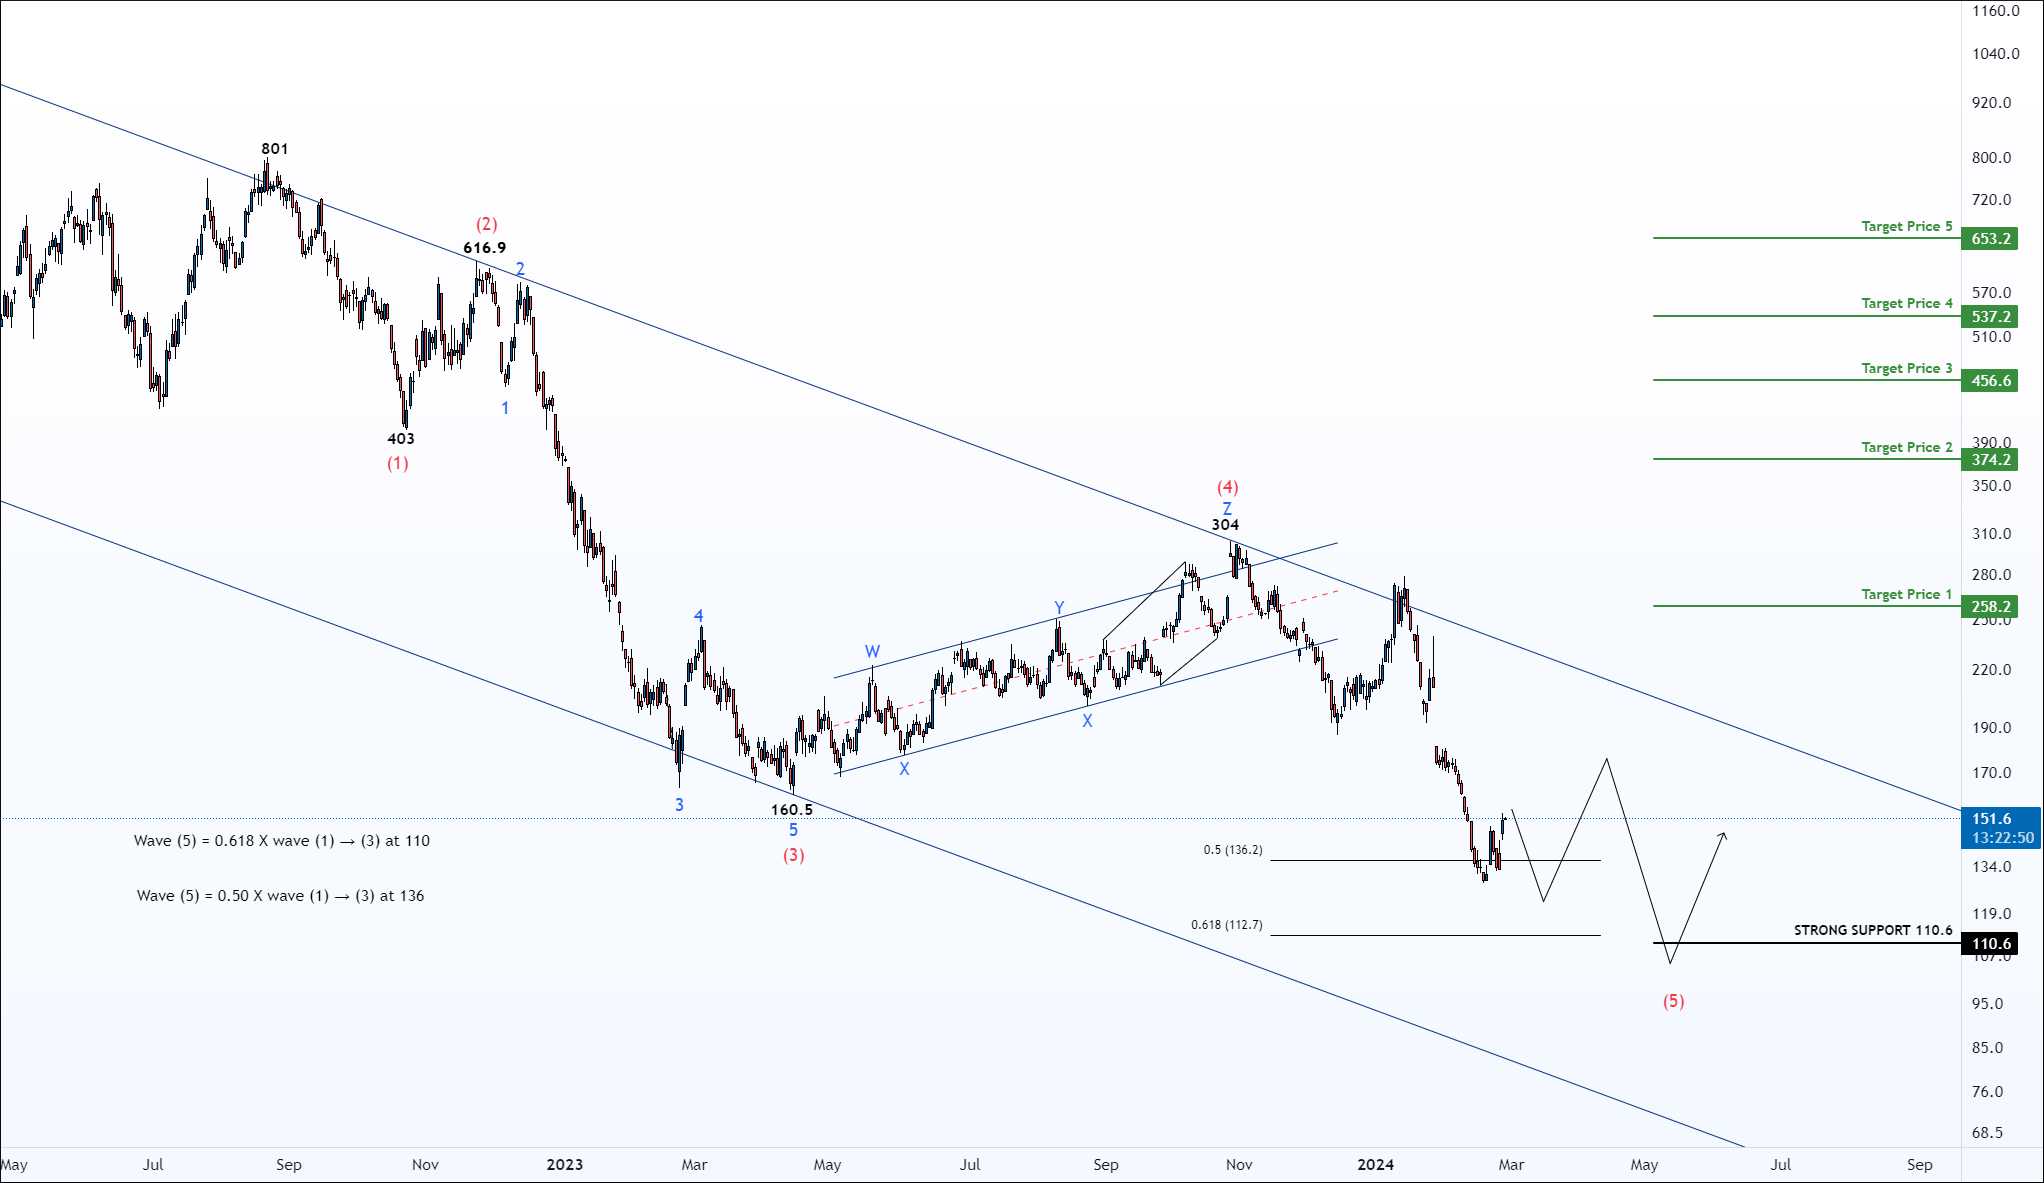
We had written clearly, “The angle from 112.5 to 129.2 looks bearish. If the price breaks down the lower band of Channel (B), traders can short for the following targets: 119 – 115 – 110+”
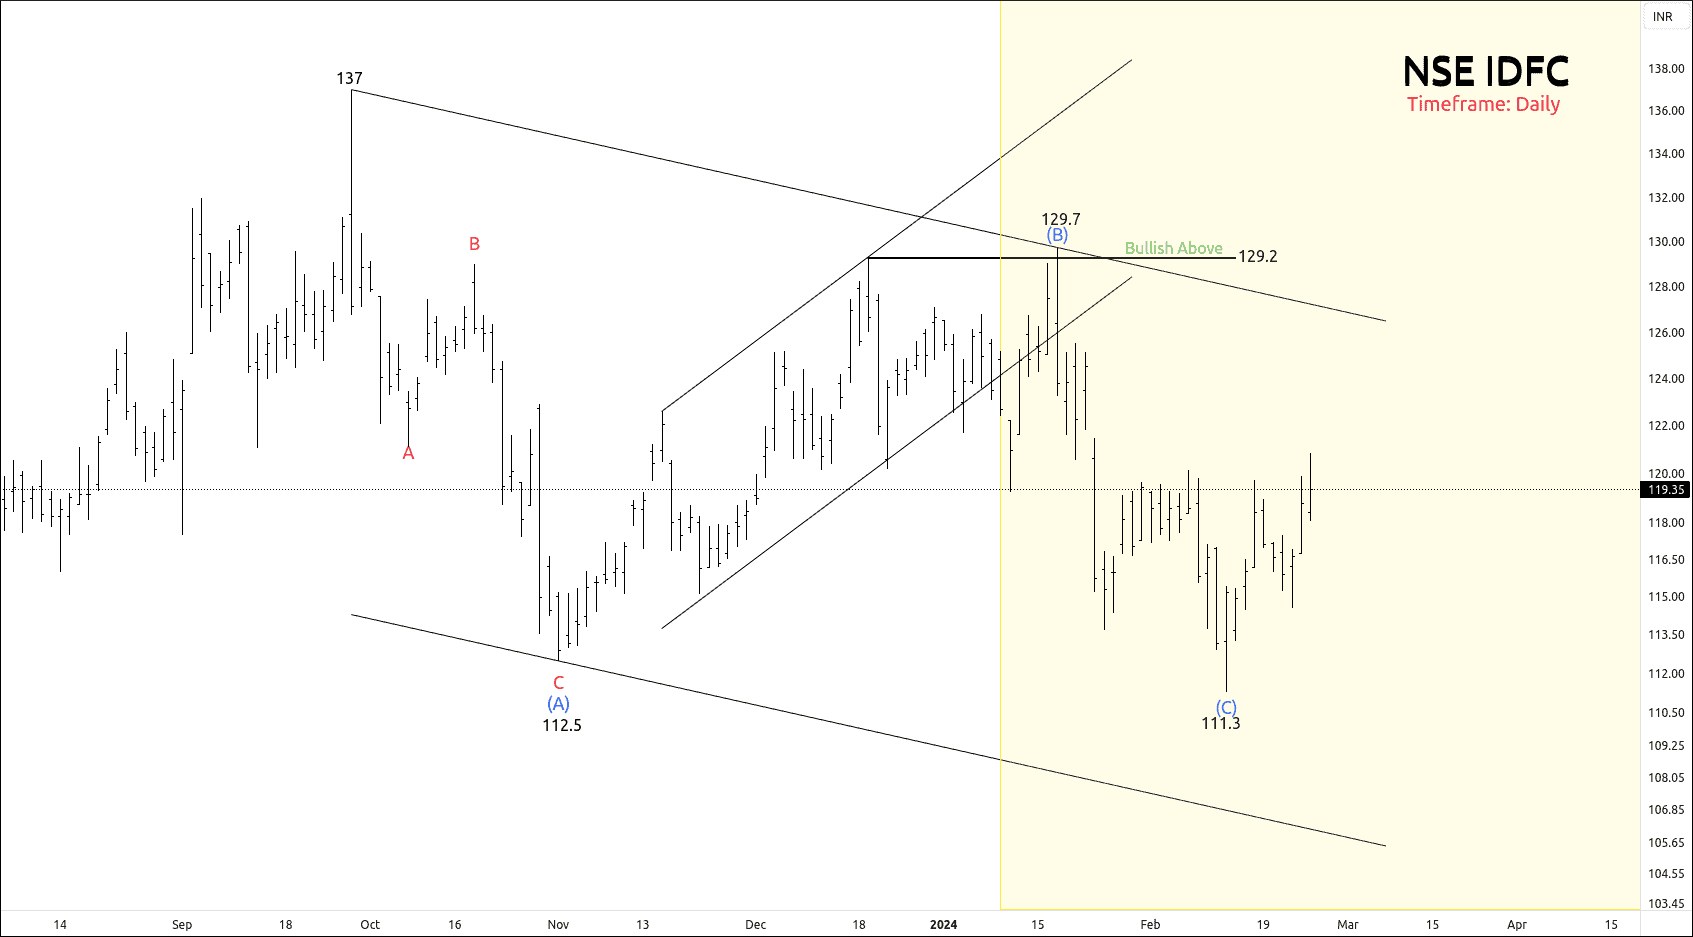 AFTER
AFTER
Timeline:
[23 January 2024]
- 09:45 AM – NSE IDFC Touched the first target of 119.
[24 January 2024]
- 09:15 AM – Price hit the second target of 115.
[13 February 2024]
- 09:15 AM – Price made a new low of 111.3 which is close to our final target of 110.
This Swing setup was capable to provide more than 10% return.
We will update more setups soon.