NSE FIEMIND – Trading Insights & Updates

Did you trade NSE FIEMIND Wave setup?
Click here: Trade Setup – BANCOINDIA, BHARTIARTL, CIGNITITEC & More

Free nse cignititec chart calls

We had written clearly, “If the price manages to sustain above 2435, traders may consider trading for the following targets: 2494 – 2556 – 2636+”

Timeline:

[23 February 2024]

  • 09:15 AM – NSE FIEMIND hit the first target of 2494.

[26 February 2024]

  • 12:15 PM – Price touched the second target of 2556, and made a new high of 2572.

If you have traded this setup, you could have made more than 5.5% or 143 points in just four trading session.
Continue reading

MCX Gold Analysis & Economic Outlook: Feb 25 – Mar 1, 2024

mcx gold weekly chart calls

Analyzing Gold’s Technical Trends and Economic Influences

MCX Gold is currently moving within a parallel channel, suggesting potential upticks to 63600 – 64160 – 65000 levels. Last week, it rose by 0.75%, gaining 467 points.

free commodity mcx daily chart tips

Gold faces selling pressure near the Control Line. To maintain an upward trend, it must break the 62600 level. If not, it may drop to 61160 – 59600, especially for intraday traders.

Key Economic Events:
These events might affect gold, silver, crude oil, and natural gas prices:
Continue reading

Will NSE NESTLEIND Achieve The Final Target?

Did you trade NSE NESTLEIND Breakout setup?
Click here:Trade Setup: ASHAPURMIN & NESTLEIND

Free ashapuramin chart calls

We had written clearly, “This presents a promising opportunity for traders to consider buying the security on a pullback. If the price maintains itself above 2525, traders may target the following levels: 2540 – 2572 – 2601+. Free subscribers can take the previous day’s high as an invalidation level.

Timeline:
[21 February 2024]

  • 10:05 AM – Price touched the first target of 2540.

[23 February 2024] [Today]

  • 12:40 PM: NSE NESTLEIND hit the second target of 2572.

We will update further information for premium subscribers soon.

Continue reading

NSE ASHAPURAMIN – Will Price Hit The Final Target?

Did you trade NSE ASHAPURAMIN Wave setup?
Click here:Trade Setup: ASHAPURMIN & NESTLEIND

Free ashapuramin chart callsBEFORE

We had written clearly, “Following a potential throwback, if the price manages to hold above wave 4 at 377, traders may consider initiating trades targeting the following levels: 402 – 425 – 447+”

Free NSE ASHAPURMIN chart callsAFTER

Timeline 1:

[21 February 2024]

  • 09:15 AM – NSE ASHAPURMIN Touched the first target of 402, and made  a new high of 409.3.

If you had traded only for the first target, you could have made more than 6% or 25 points in just a single trading session

Free nse ashapurmi chart callsLATEST

Timeline 2:

[23 February 2024]

  • 09:45 AM – Price reached the second target of 425, and made a new high of 430.

If you had traded only for the first target, you could have made more than 11.5% or 45 points in just a Three trading sessionContinue reading

NSE BHARTIARTL – Insights & Updates

Did you trade NSE BHARTIARTL Breakout setup?
Click here: Trade Setup – BANCOINDIA, BHARTIARTL, CIGNITITEC & More & More

Free nse cignititec chart calls

We had written clearly, ” If the price sustains above 1130, traders can trade for the following targets: 1143 – 1158 – 1176+.

Timeline:
[20 February 2023]

  • 11:15 AM – Price touched the first target of 1143.

[21 February 2023] [Today]

  • 09:15 AM – NSE BHARTIARTL hit the second target of 1158.

Will NSE BHARTIARTL Hit the final target of 1176?

We will update further information for premium subscribers soon.

Continue reading

NSE ASHAPURAMIN – Trading Tips & Updates

Did you trade NSE ASHAPURAMIN Wave setup?
Click here:Trade Setup: ASHAPURMIN & NESTLEIND

Free ashapuramin chart callsBEFORE

We had written clearly, “Following a potential throwback, if the price manages to hold above wave 4 at 377, traders may consider initiating trades targeting the following levels: 402 – 425 – 447+”

Free NSE ASHAPURMIN chart callsAFTER

Timeline:

  • 09:15 AM – NSE ASHAPURMIN Touched the first target of 402, and made  a new high of 409.3.

If you had traded only for the first target, you could have made more than 6% or 25 points in just a single trading session.

We will update further information only for premium subscribers soon.Continue reading

NSE NESTLEIND – Trading Insights & Updates

Did you trade NSE NESTLEIND Breakout setup?
Click here:Trade Setup: ASHAPURMIN & NESTLEIND

Free ashapuramin chart calls

We had written clearly, “This presents a promising opportunity for traders to consider buying the security on a pullback. If the price maintains itself above 2525, traders may target the following levels: 2540 – 2572 – 2601+. Free subscribers can take the previous day’s high as an invalidation level.

Timeline:
[21 February 2024] [Today]

  • 10:05 AM – Price touched the first target of 2540.

Will Price touch the second target of 2572?

We will update further information for premium subscribers soon.

Continue reading

Trade Setup – BANCOINDIA, BHARTIARTL, CIGNITITEC & More

Free nse cignititec chart calls

Timeframe: Daily

After reaching a low of 777.7, the price began to form an impulse structure. It is currently trading above its 35, 50, 100, and 200-day moving averages. The average true range (ATR) of the price increased to 42, although the average directional index (ADX) is not showing a consistent upward trend.

As per the Elliott wave analysis, the price has accomplished complex correction of wave (4) with 61.8% retracement of wave (3) at 942. The security formed sub-wave one at 1040, followed by sub-wave two at 980.

NSE BANCOINDIA: Breakdown Potential Analysis

NSE BANCOINDIA looks weak on the daily timeframe. Price recently broke down a crucial support level of 675 and started falling. ATR of the price reached 31.19.

Security has broken down the 10/50 moving average that signals bears are taking control over the bulls. If the price sustains below 675, traders can short for the following targets: 665 – 652 – 636+. Free subscribers can take the previous day’s low as an invalidation level.

Is the Grip of Bears Loosening on NSE BHARTIARTL?

NSE BHARTIARTL has given a strong move in the previous trading session. The ATR of the price reaches 25, and ADX shows strength by being above 30. The price is above 10/35/50 Moving average

It Looks like the price has broken our flat corrective structure on the daily timeframe chart. If the price sustains above 1130, traders can trade for the following targets: 1143 – 1158 – 1176+. The target can be extended following an aggressive breakout of 1144.

Free subscribers can take the previous day’s low as an invalidation level.

NSE FIEMIND – Correction Breakout

NSE FIEMIND broke out of wave B of the correction at 2434. The price is currently trading above the 35, 50, 100, and 200-day moving averages. Following the breakout, the average true range (ATR) has begun to trend upward.

The slope of the move appears impulsive, and the breakout from the flat pattern occurred with a large candle. If the price manages to sustain above 2435, traders may consider trading for the following targets: 2494 – 2556 – 2636+. Free subscribers can take previous day’s high as invalidation level.

Premium subscribers will have excess to further information.

NSE GOODLUCK – Trade Setup

Continue reading

NSE TECHM – Trading Insights & Updates

Did you trade the NSE TECHM Bearish setup?
Visit here: Trade Setup – NSE ULTRACEMCO, ASIANPAINTS & More

Free nse ultracemco chart calls

I had written clearly,”If the price manages to sustain below 1300, traders may consider selling for the following targets: 1287 – 1270 – 1258+”.

Timeline:

[19 February 2024]

  • 09:45 AM – NSE TECHM touched the first target of 1287.

If you have this setup, you could have made more than 14 point in just a first target.

We will update further information soon.

Continue reading

NSE WIPRO – Bull Victory

Did you trade the NSE PNB Bearish setup?
Visit here: TRADE SETUP – NSE HAL, WIPRO, PNB & More

We had written in clear words, “Should the price successfully breach and maintain levels above 501, traders may consider initiating positions with target prices set at 510 – 527 – 538+..

Timeline:

[13 February 2024]

  • 02:45 PM – NSE WIPRO hit the first target of 510, and made a high of 513.

[16 February 2024]

  • 10:45 AM – Price hit the second target of 527.
  • 02:00 PM – Price achieved the final target of 538.

If you have traded this setup, you could have made more than 43 points or 8.75% ROI in just three trading session.Continue reading

NSE PNB & AARTIDRUGS – Trading Insights & Updates

Did you trade the NSE PNB Bearish setup?
Visit here: TRADE SETUP – NSE HAL, WIPRO, PNB & More

If the price continues to sustain below 121.25, it presents an opportunity for traders to initiate short positions with the following downside targets: 118.35 – 115.15 – 112.20+.

Timeline:

[13 February 2024]

  • 09:20 AM – Price touched the first target of 118.35.
  • 09:35 AM – NSE PNB made a new low of 115.70, which is close to our second target of 115.15.

If you have traded this setup, you could have made more than 4 points or 3.7% return in just a single trading session. Continue reading

NSE WIPRO – Tips & Updates

Did you trade the NSE WIPRO Breakout setup?
Visit here: TRADE SETUP – NSE HAL, WIPRO, PNB & More

We had written in clear words, “Should the price successfully breach and maintain levels above 501, traders may consider initiating positions with target prices set at 510 – 527 – 538+.”

Timeline:

[13 February 2024]

  • 02:45 PM – NSE WIPRO hit the first target of 510, and made a high of 513.

If you have traded this setup, you could have made more than 2.47% or 12 points in just single trading session.Continue reading

TRADE SETUP – NSE HAL, WIPRO, PNB & More

NSE WIPRO – breakout setup

NSE Wipro has exhibited a cup and handle pattern on its daily timeframe chart, suggesting a potential breakout scenario. The stock is currently trading above its 10/35/50 Simple Moving Average band, indicating bullish momentum. Additionally, the Average Directional Index (ADX) reading is above 33, indicating significant strength in the prevailing trend.

Should the price successfully breach and maintain levels above 501, traders may consider initiating positions with target prices set at 510 – 527 – 538+. It is prudent for free traders to use the previous day’s low as a reference point for invalidation of the setup.

We will update further information for premium subscribers only.Continue reading

NSE ADANIENT – Elliott Wave Projection

Free nse adanient daily chart calls

Timeframe: Daily
NSE ADANIENT had accomplished wave ((4)) at 1103 and started rising upward. The Average direction index is 34, which indicates the current trend is strong. Price has taken support from 50 SMA and trading above 200 EMA.

As per Elliott wave projection, The start of an impulse was a bit painful. Price constructed a leading diagonal on the wave (1). Wave (2) was a double zigzag because of the sharpness of the current trend. Price broke out wave (1) and established a building block of wave (3). Traders can count sub-waves 1 and 2 of wave (3). Wave (3) can occur at 4442 is 1.618% of wave (1). Possible targets of wave (3) are 3430 – 3816 – 4440+. Note that price may take time and form consolidation and break approach to reach the targets. Traders should wait for a pullback after every breakout.

We will update further information soon.

Get free important share market ideas on stocks & nifty tips chart setups, analysis for the upcoming session, and more by joining the below link: Stock Tips

Have you any questions/feedback about this article? Please leave your queries in the comment box for answers.

Disclaimer: The information provided on this website, including but not limited to stock, commodity, and forex trading tips, technical analysis, and research reports, is solely for educational and informational purposes. It should not be considered as financial advice or a recommendation to engage in any trading activity. Trading in stocks, commodities, and forex involves substantial risks, and you should carefully consider your financial situation and consult with a professional advisor before making any trading decisions. Moneymunch.com and its authors do not guarantee the accuracy, completeness, or reliability of the information provided, and shall not be held responsible for any losses or damages incurred as a result of using or relying on such information. Trading in the financial markets is subject to market risks, and past performance is not indicative of future results. By accessing and using this website, you acknowledge and agree to the terms of this disclaimer.

Part 1 – Monthly Examination of EUR/USD Utilizing Varied Approaches

Free forex EURUSD chart calls

Price action Breakdown Analysis:

It is the EURUSD monthly timeframe, and it shows a downtrend for more than 15 years. The price has settled in a downward value area.

Elements of price action Breakdown:

  1. Excess:
    There are nine price excesses, four on the upper band and five on the lower band. It shows that the sellers were too aggressive when the price touched the upper band of the channel in comparison with the lower band at buyers. Buyers/Bulls tries makes the initiative to breakout the structure but end up when another party finds the price convenient for them. 
  2. Control line:
    The control line represents the gravitational force to the price. The price can’t stay away until it breaks the range. There are twelve touches on the control line, and few are mentioned on the chart.
  3. No Trading Activity Zone:
    No trading activity is the zone where one party, either bull or bear, takes control and outnumbers the other. There are a total of 14 no-trading activities zone. Both of the participants have seen each other.
  4. Sub-value area:
    A rectangle sub-value area has taken place from March 2015 till now. An excess became a great place to buy the move, yet the upper band of the sub-value area provides strong resistance. The control line of this value area at 1.1480 is sharp enough to act as a pivot level. It could be a resistance to the current price.
Free fx eurusd chart callsContinue reading

NASDAQ AMAZON – Wave Strength Analysis On Daily Chart

Free nse amazon chart calls

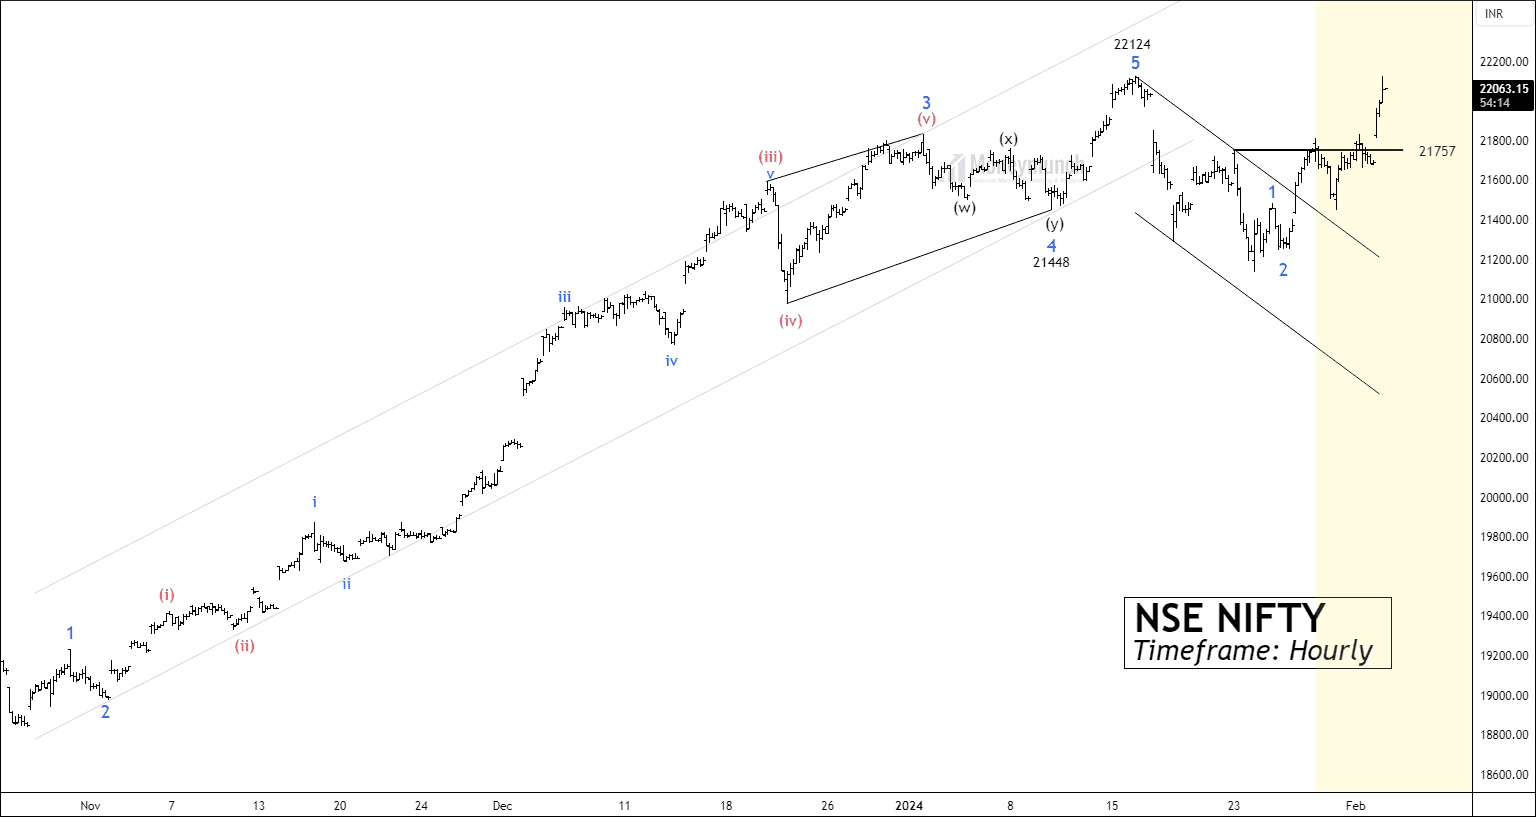
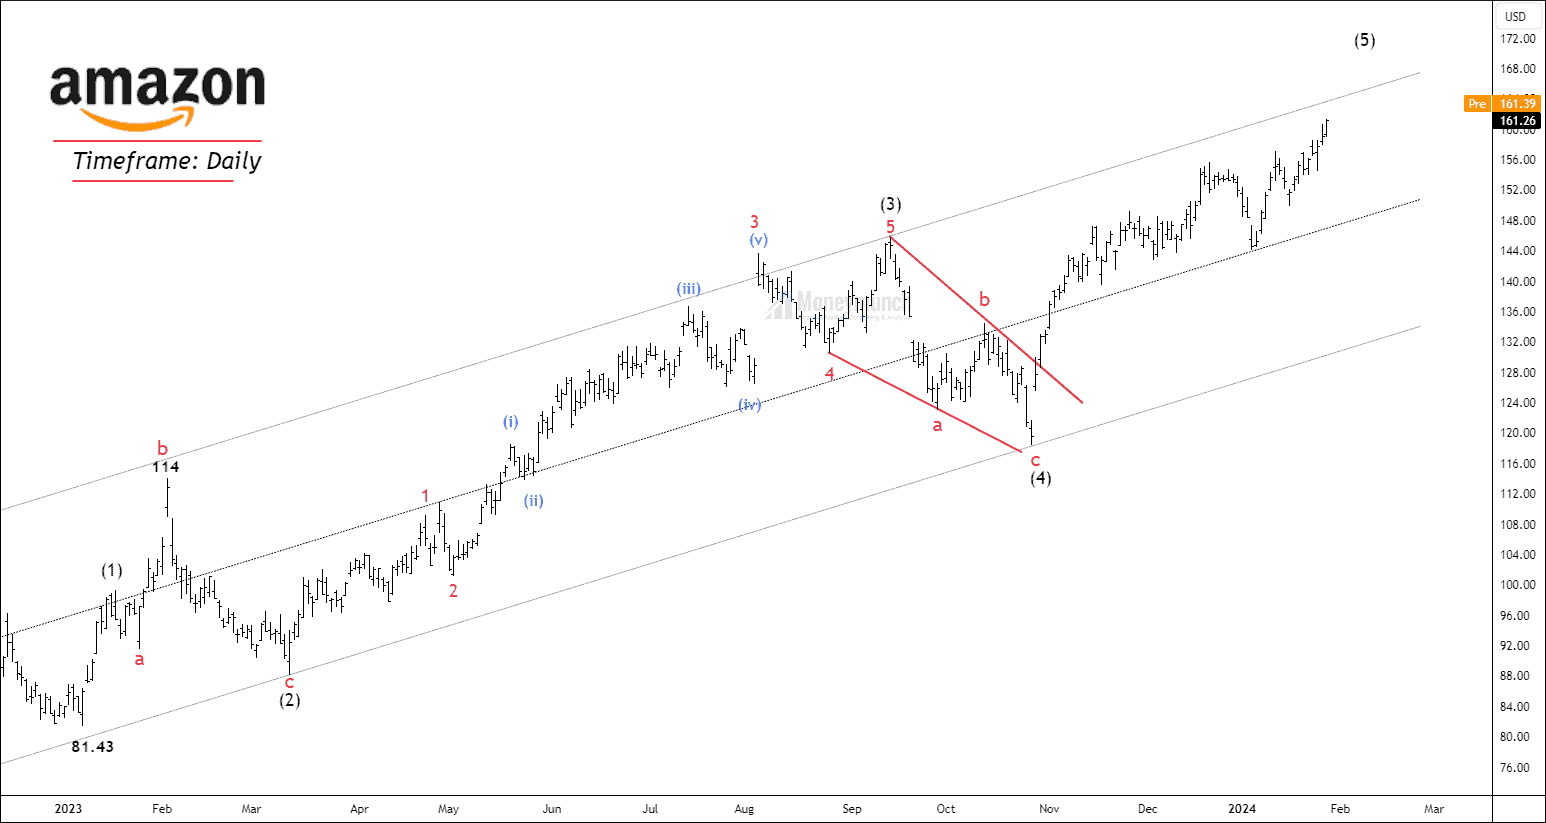
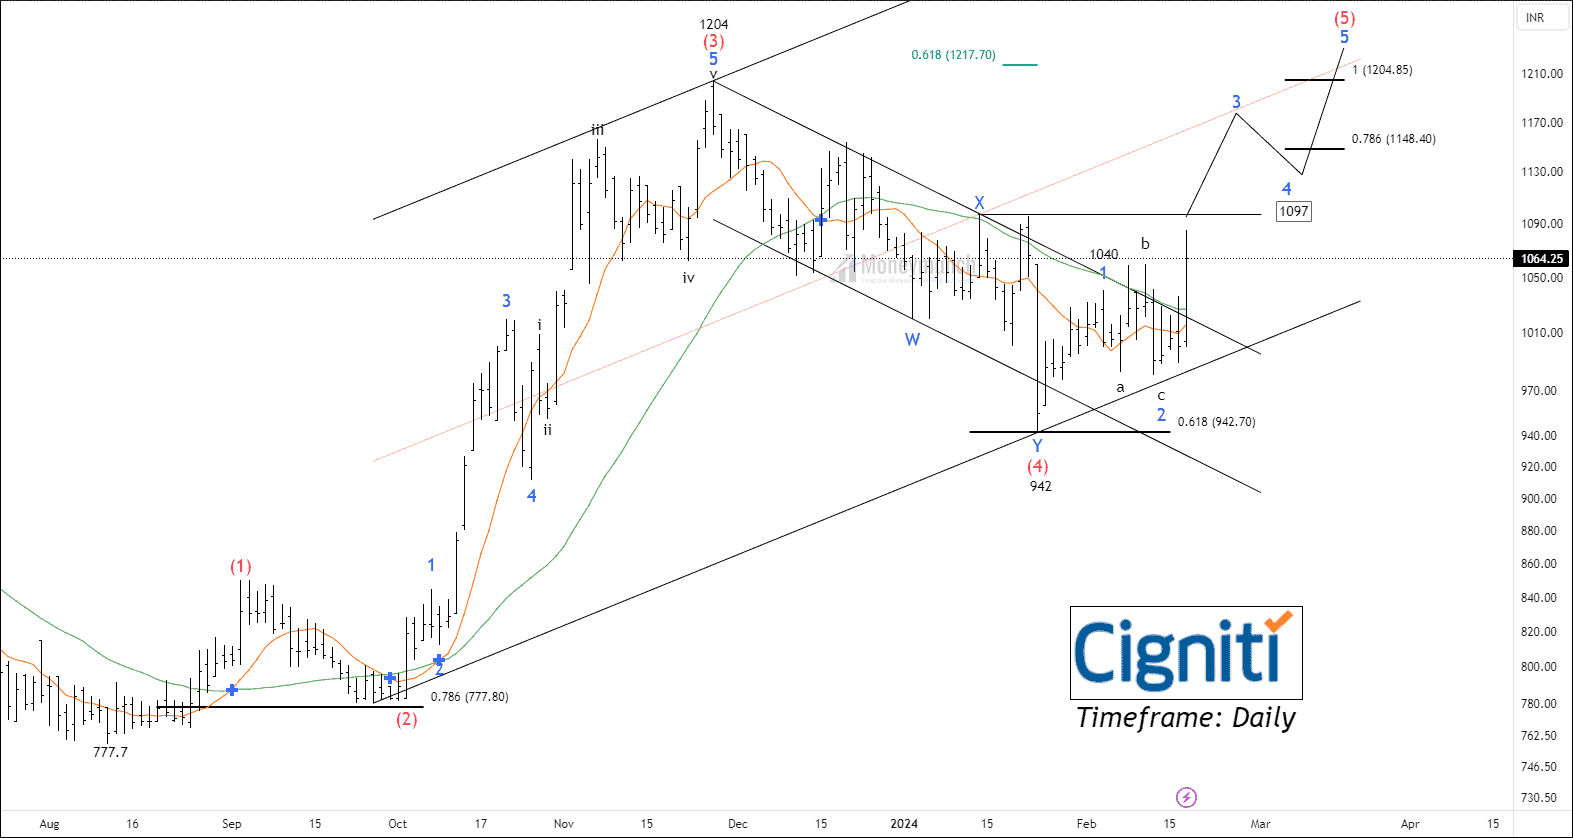
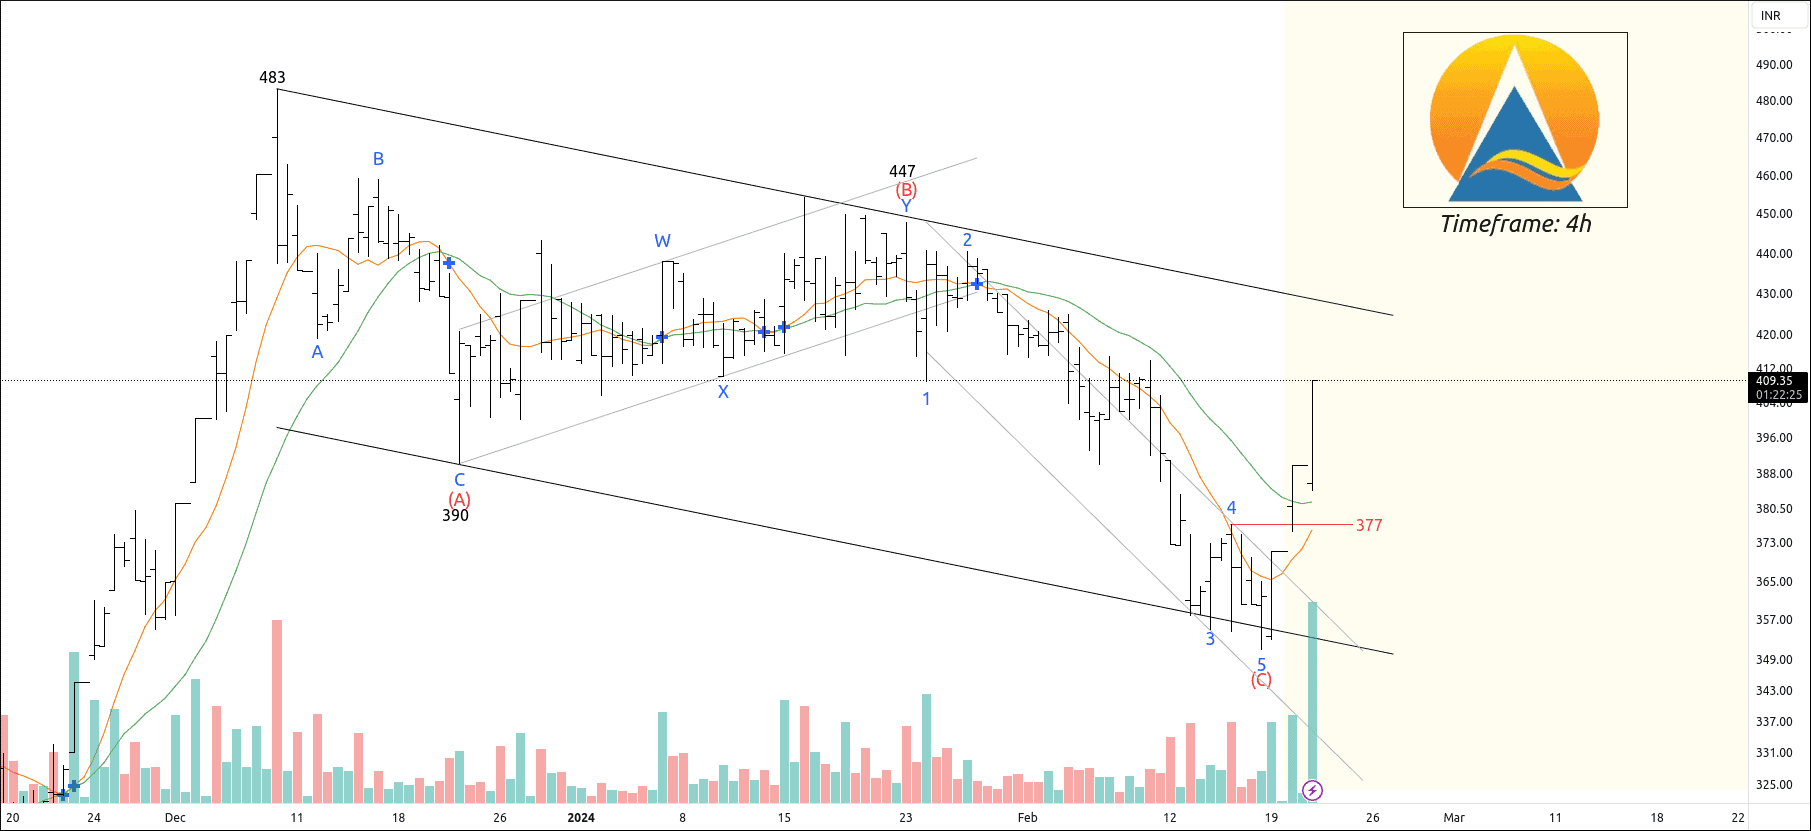
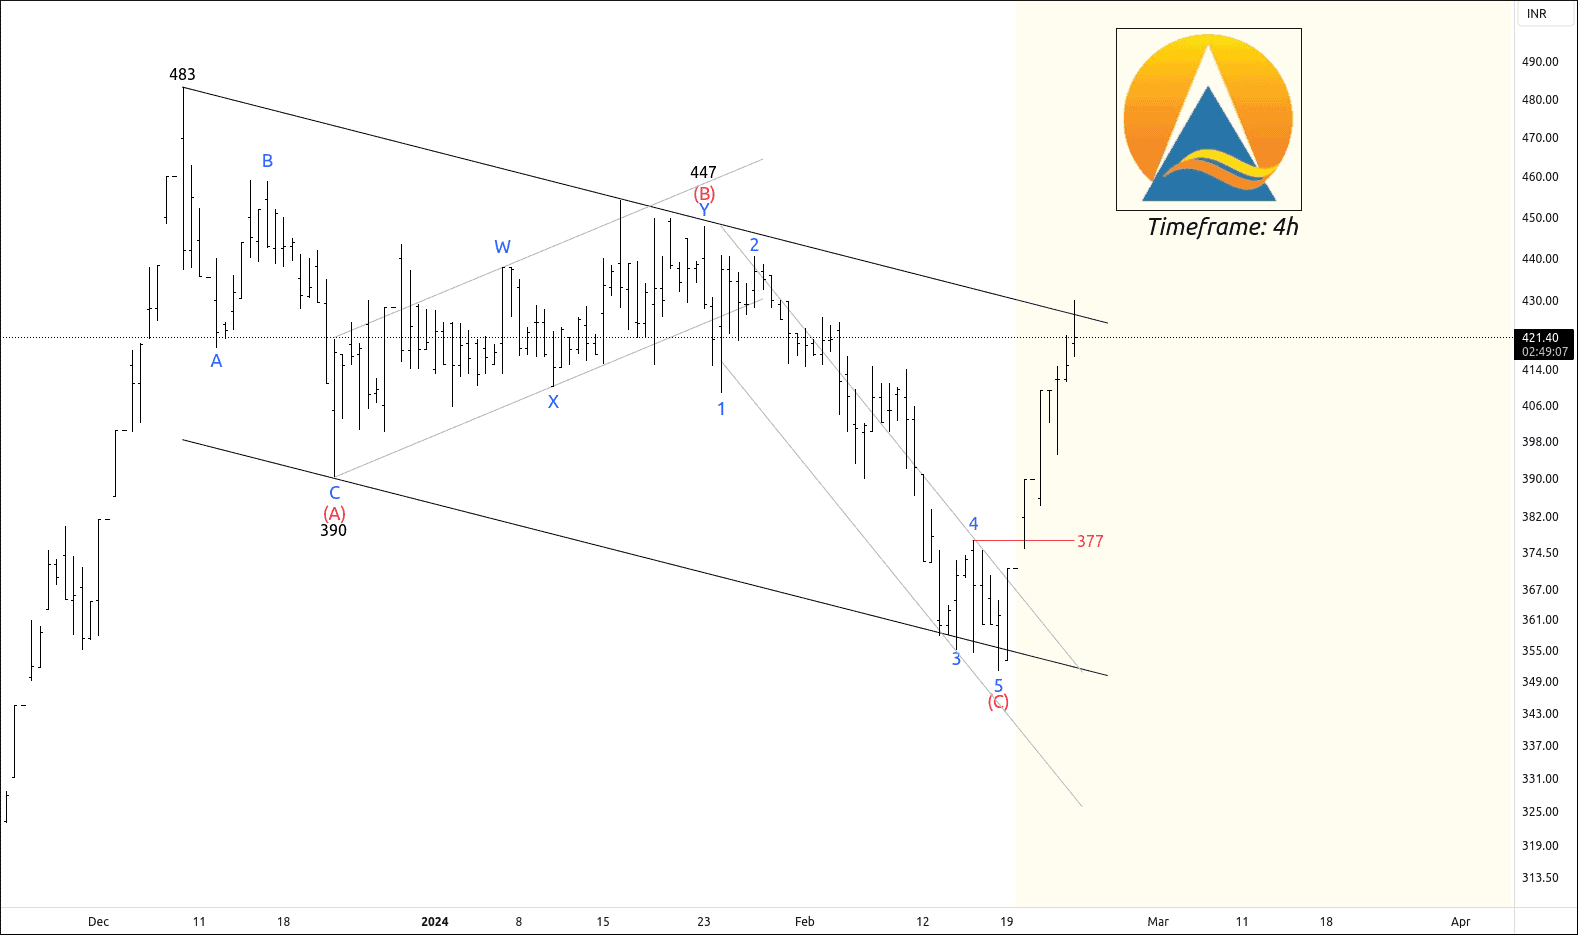
NASDAQ AMZN has started an impulsive cycle from 81.33, and the price is forming the final wave (5). The price has accomplished a corrective wave (4) and formed sub-waves of the impulsive wave (5).

Wave Formation & Fibonacci relationships:

Wave (2):

  • Wave 2 has formed an expanded flat with a 3-3-5 structure.
  • Price retraced 78.6% of wave (1).

Wave (3):

  • Wave 3 has constructed a motive structure.
  • Wave 3 is an extensive wave with a 3.618 multiple of wave (1).
  • The sub-structure and element structure is visible.

Wave (4)

  • Wave 4 is a zigzag formation and can be mentioned as a triangle by changing the labels.
  • Wave (4) retraced 50% of wave (3).

Wave (5)

  • The structure of wave (5) does not look like an ending diagonal. So, the last option for us is to assume it is an impulse.
  • The common Fibonacci relationships are:
    – Wave 5 = Wave 1
    – Wave 5 = 0.618 reverse Fibonacci of wave 4
    – Wave 5 = 0.618 X Waves 1 through 3
    – The upper band of the parallel channel and throw-out out in many cases.

ADX (average directional index):
The ADX (14-day setting) shows strength coming but doesn’t advocate the cause of the shart surge. Traders must note to take high probability traders after ADX crosses 30. It only measures whatever trend it is, should one trade or not, by measuring the strength of the trend.

ADX level of 22 shows that the market can be choppy in many instances.
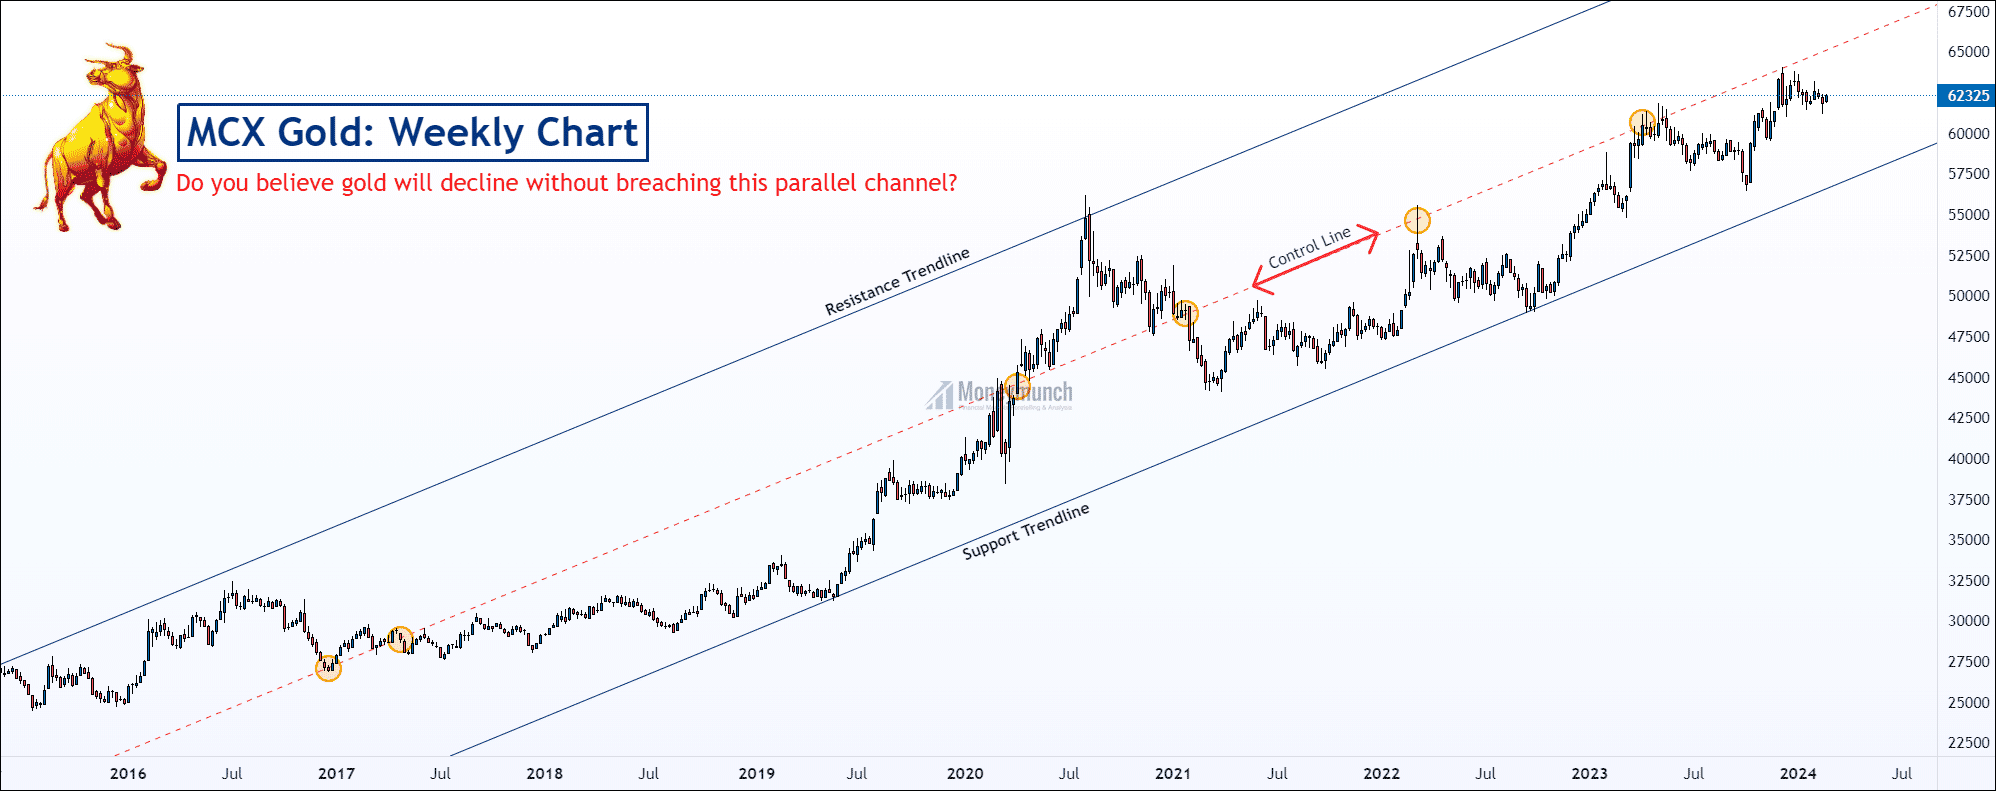
Weekly Trend:

The weekly trend looks strong, as the price has broken out a crucial resistance zone at 143. If the weekly trend & Daily trend are bullish, day traders can take long traders to be within the trend.

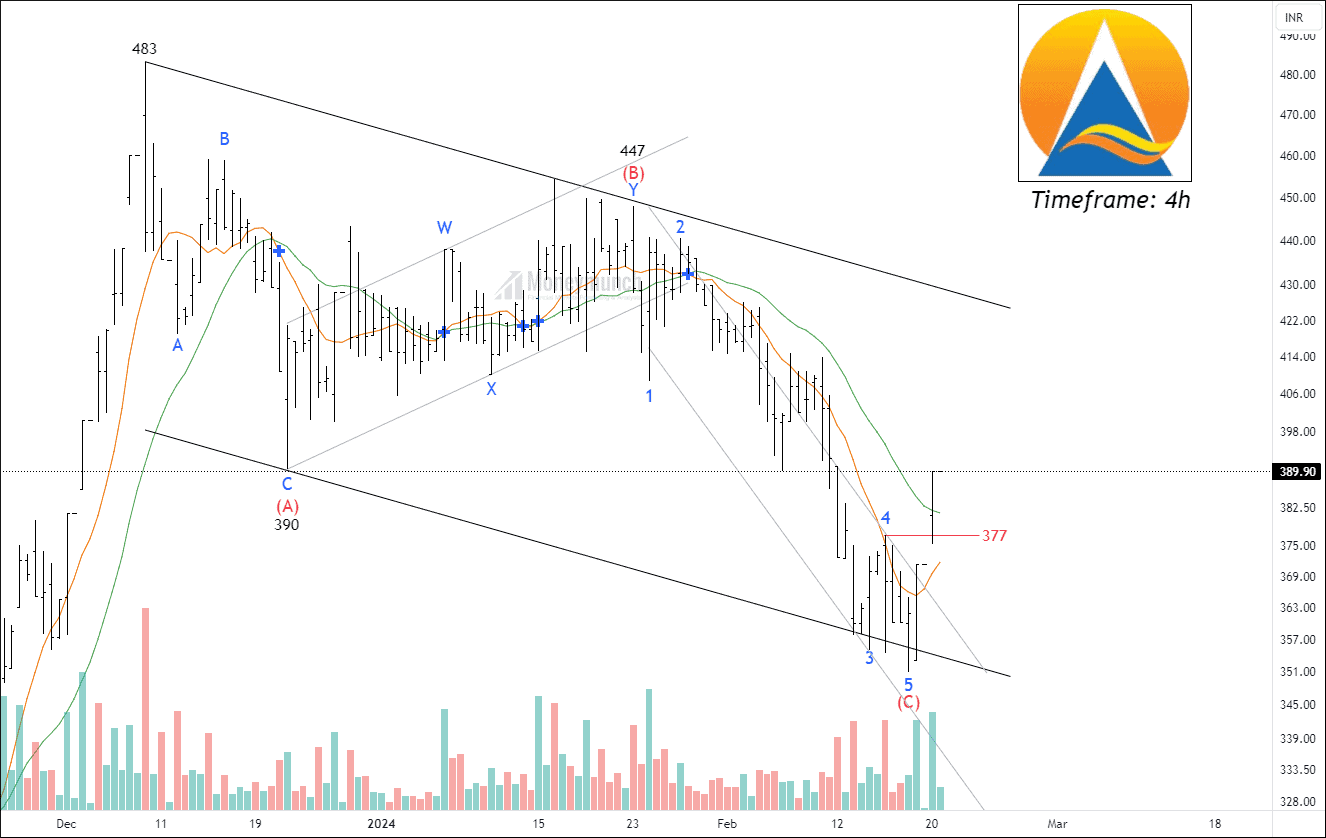
To look in-depth, we have to analyze the shorter timeframe. This way, we can get a clear story of wave (5) before initiating any position.Continue reading