Timeframe: Daily
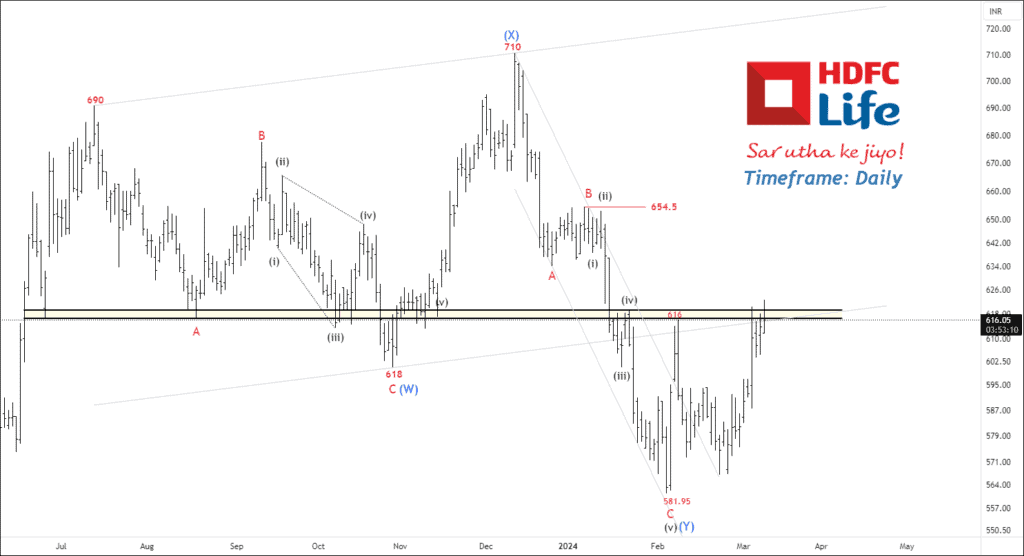
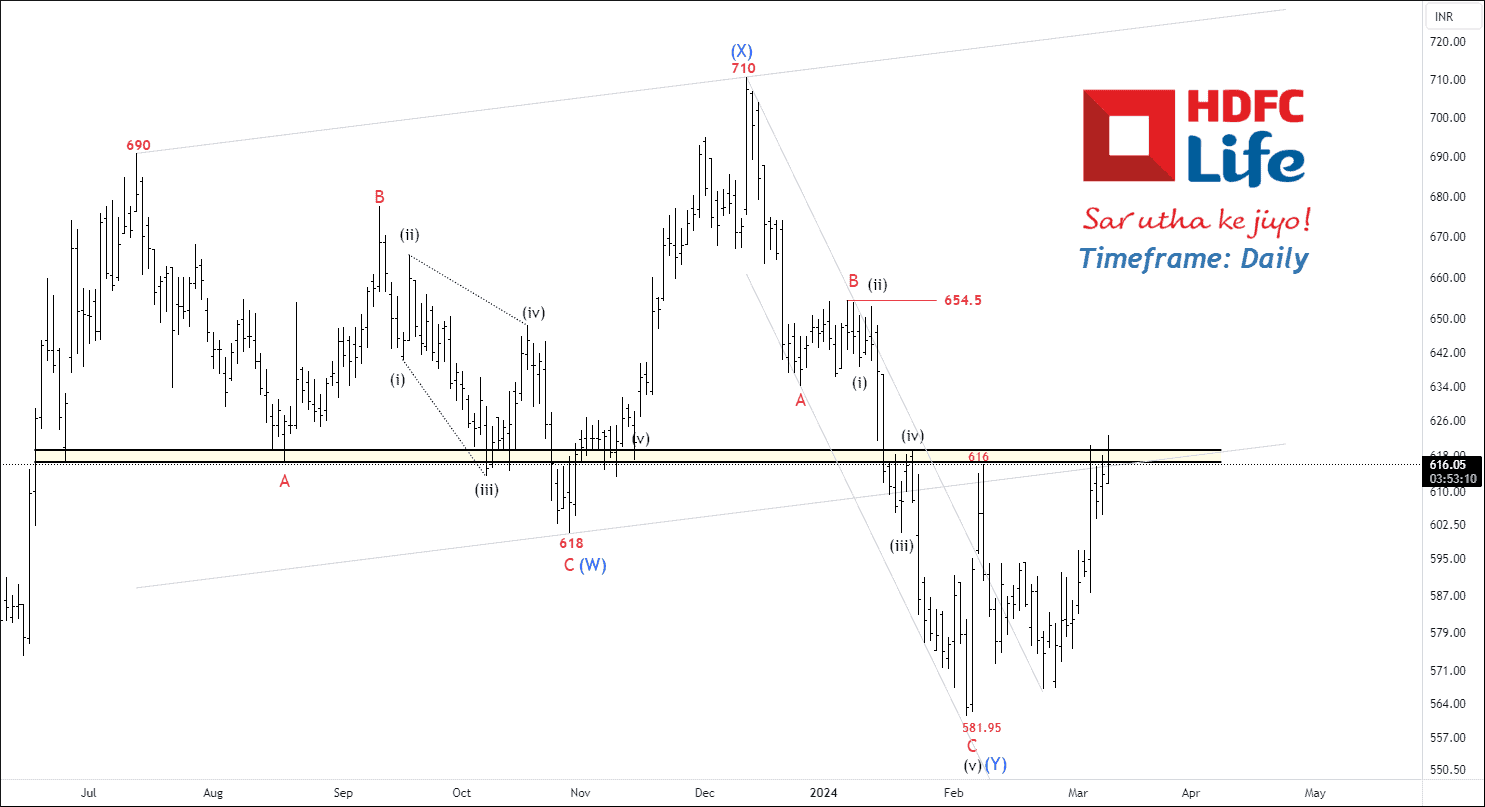
HDFC Life appears to be undergoing a corrective structure in the form of a W-X-Y pattern, indicative of a flat wave formation. Recent price action has seen the stock breaking above key moving averages, namely the 50, 100, and 200 EMAs. Notably, there’s a significant resistance zone around 620.
The ADX, a measure of trend strength, has climbed to 20, suggesting increasing momentum in the price movement. It’s observed that the impulsive wave (v) of C of (Y) may have reached saturation, hitting a 2.618% extension at 581.95.
Anticipating a potential strong upward move, traders are eyeing targets at 636 – 654 – 690. Targets following a breakout above the long-term resistance zone. However, it’s crucial to acknowledge the significance of this resistance level, as failure to breach it could lead to a retracement towards lower lows.
Stay tuned for further updates on this analysis.
Get free important share market ideas on stocks & nifty tips chart setups, analysis for the upcoming session, and more by joining the below link: Stock Tips
Have you any questions/feedback about this article? Please leave your queries in the comment box for answers.


Amazing work!
Wave analysis works very well in the Indian stock market.
This chart is 🔥🔥🔥🔥
Thanks for sharing, this could be really helpful for people looking to buy dips
Warren Buffay says to buy when everyone is scared or something to that effect