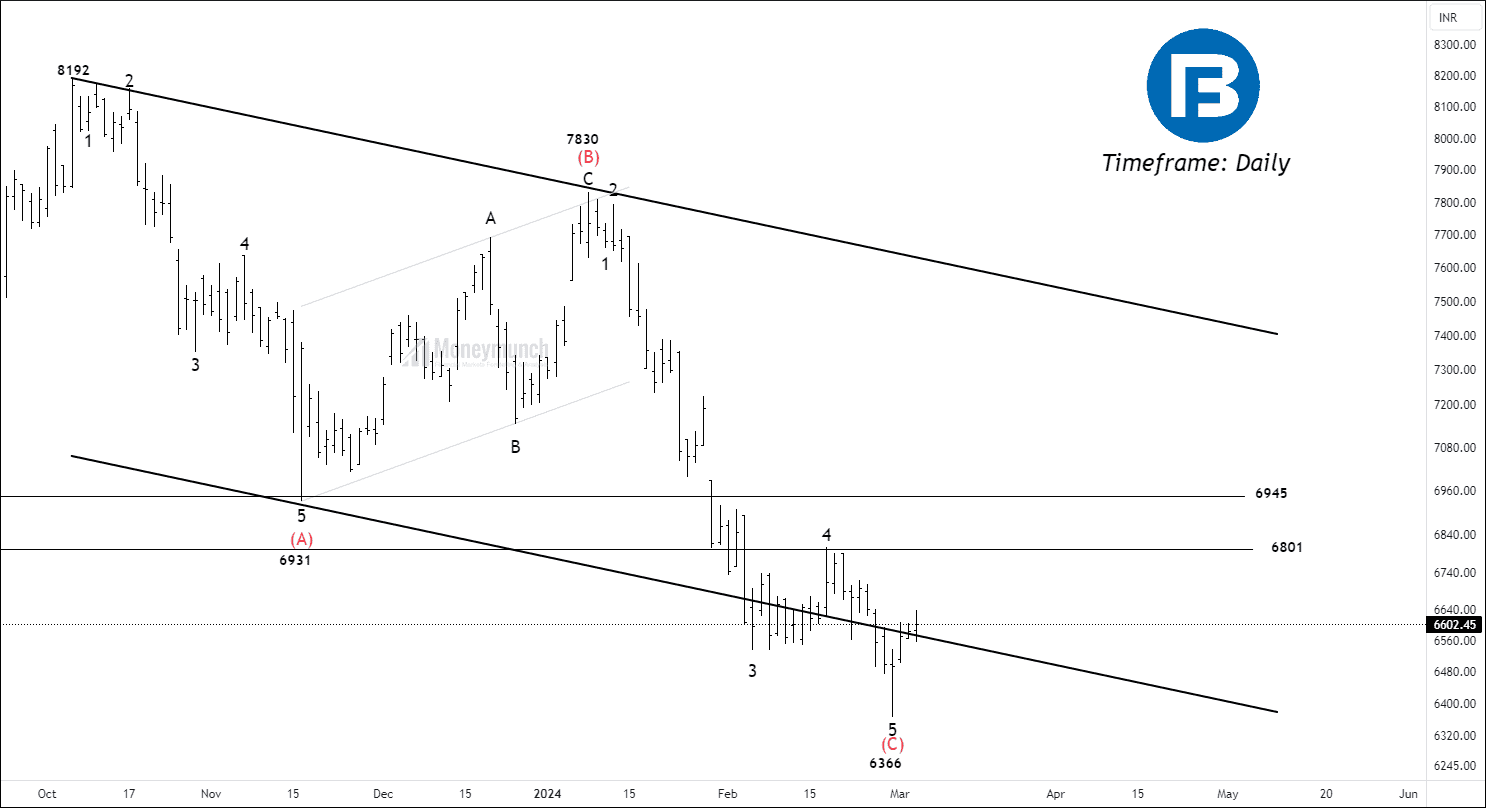
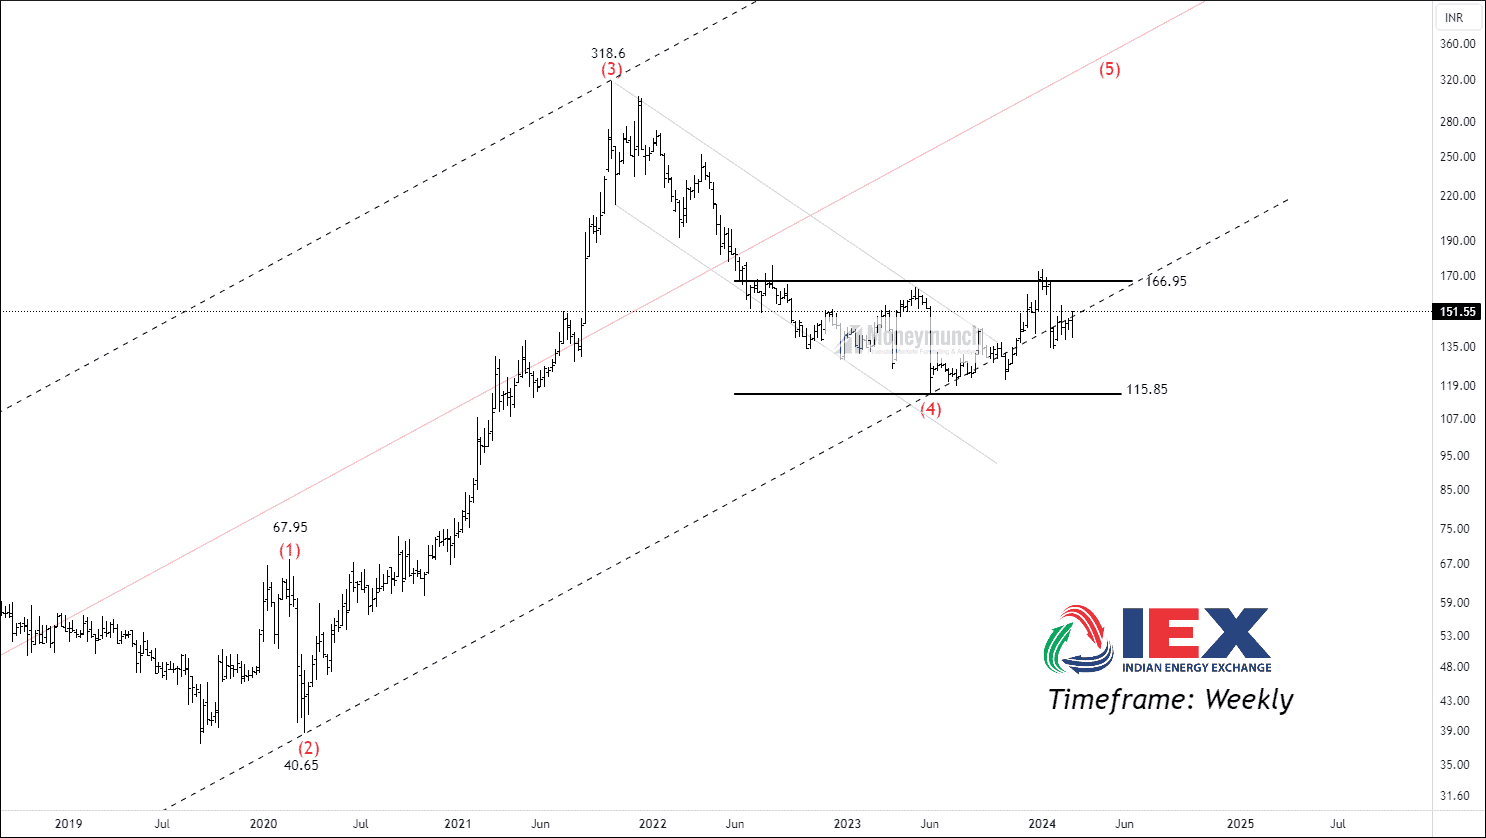
NSE IEX – Elliott Wave Projection
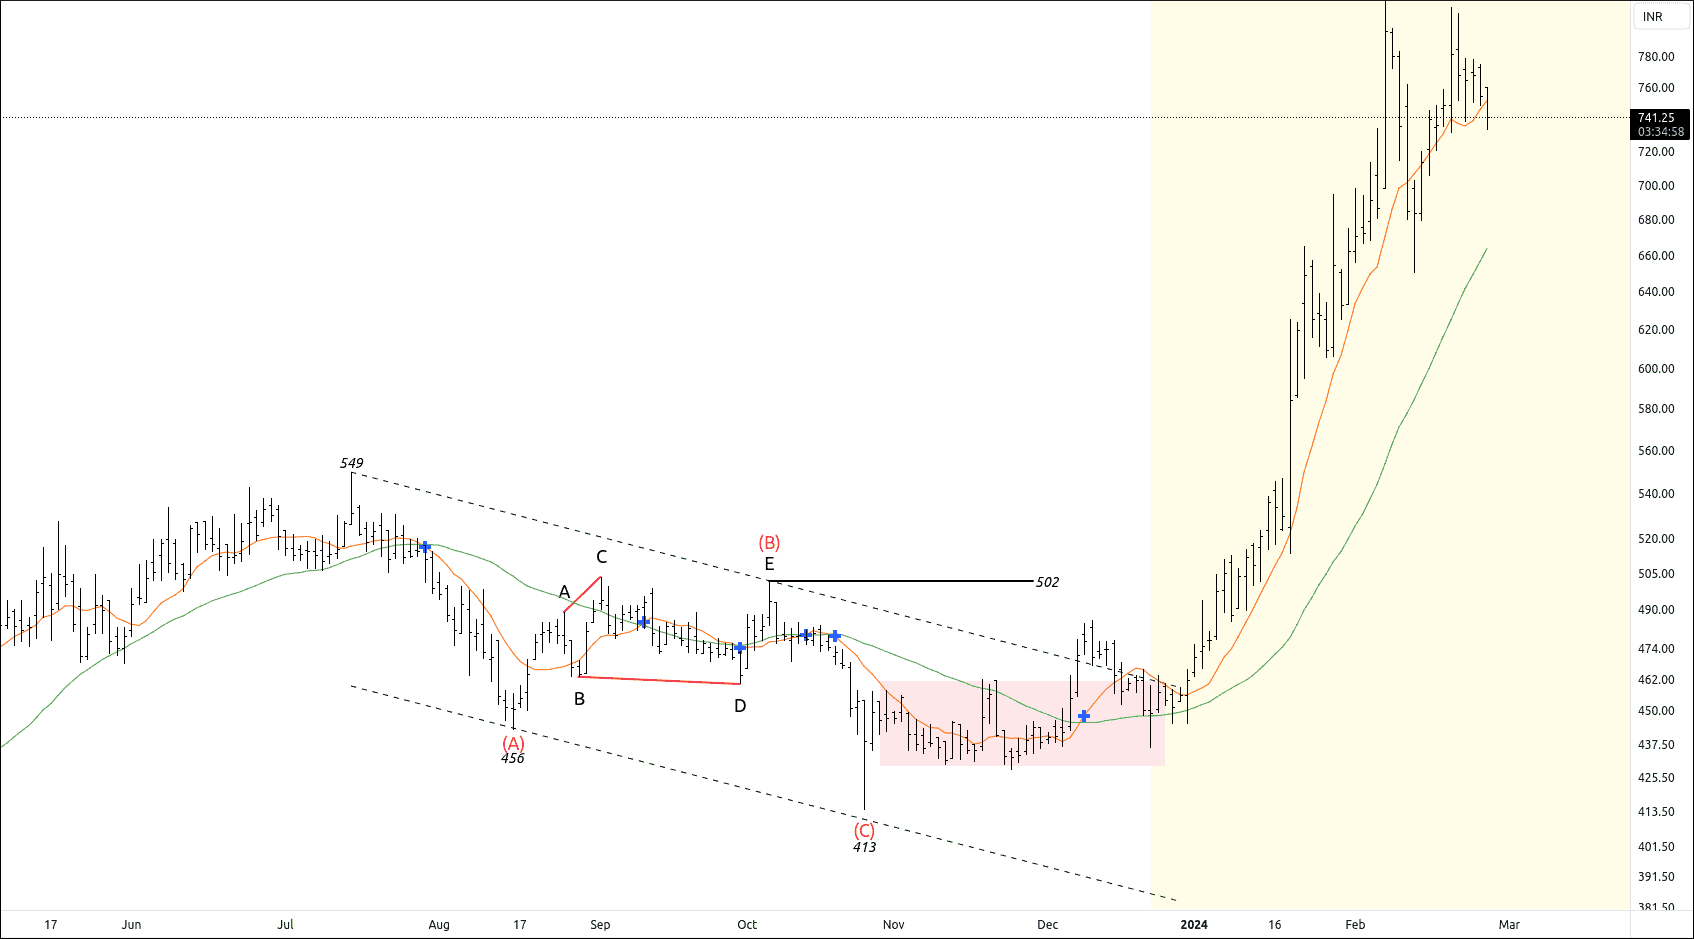
NSE EIHAHOTELS Achieves a Triumphant 76% Gain
Did you trade remember NSE EIHAHOTELS Wave setup?
Click here: NSE SBICARD & EIHAHOTELS – Trade Setup
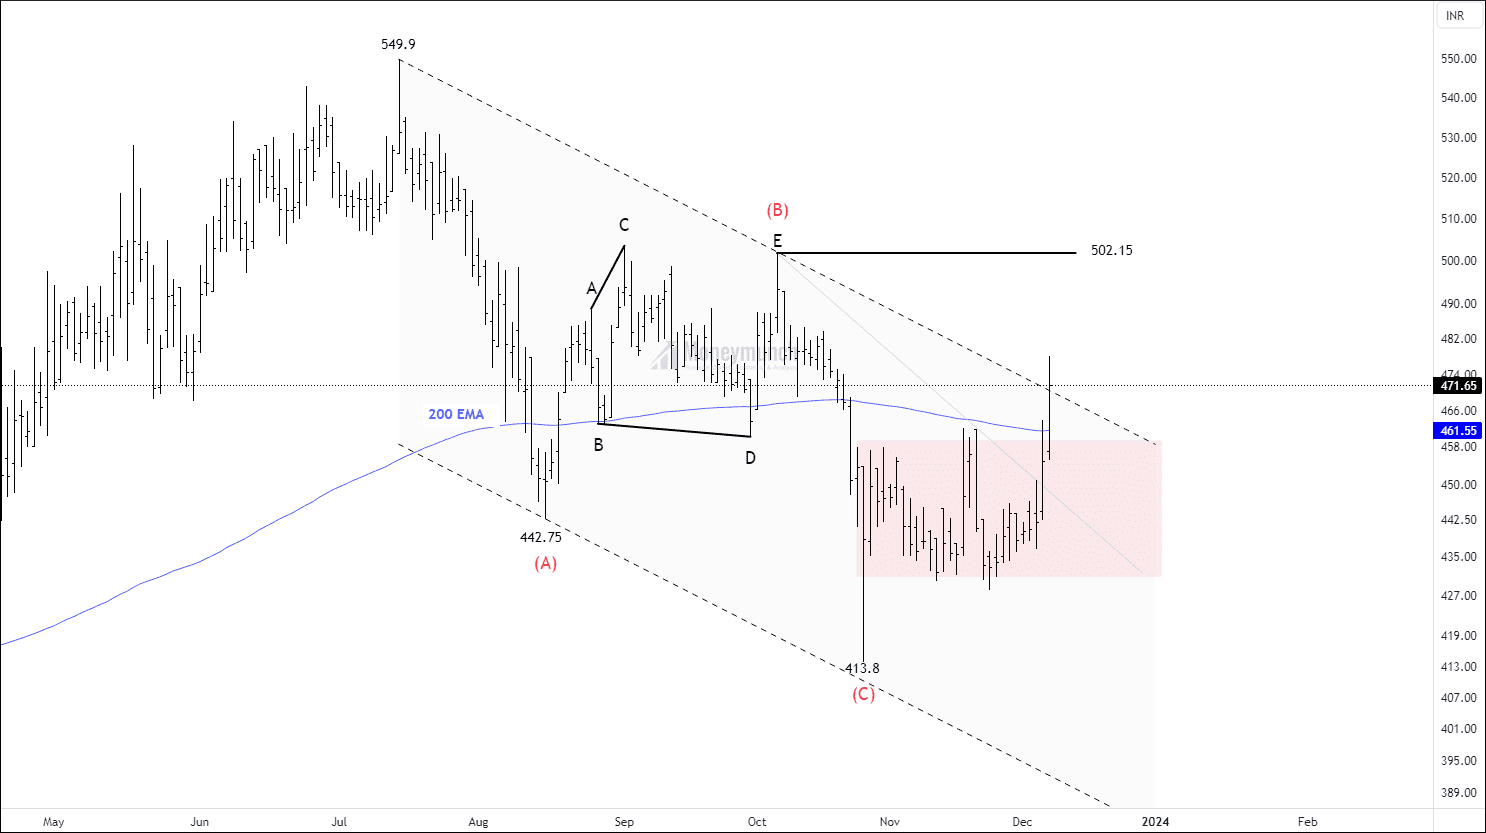 BEFORE
We had written clearly, “If the price breaks out and sustains above the corrective channel, traders can trade for the following targets: 502 – 524 – 542+”
 AFTER
AFTER
[5 January 2024]
- 09:15 AM – Price touched the first target of 502.
[16 January 2024]
- 10:45 PM – EIHAHOTELS hit the first target of 524.
[18 January 2024]
- 01:45 PM – Price Achieved the final target of 542, and made a new high of 625.
[7 February 2024]
- 09:15 AM – NSE EIHAHOTELS made a new high of 818.95.
This Wave setup has given more than 76% return within 2 months.
We will update more Wave setups soon.
Trade Setup – NSE 3MINDIA, FINEORG & More
NSE 3MINDIA – Breakout Setup
3MINDIA reached a peak of 39876 before experiencing a significant decline of 24.16% within a span of two months. Although the price has remained above the 10-day moving average, it hasn’t surpassed the 35 and 50-day moving averages. The ADX (Average Directional Index) has dropped to 15.
The sub-wave 4 structure of 3MINDIA has been breached, signaling a potential opportunity for traders. However, it’s crucial for traders to confirm any pullback and entry after ensuring sustainability. If the price manages to sustain itself above 31500, traders may consider initiating trades with the following targets: 32425 – 33079 – 33600+. Free subscribers can take the previous day’s low as an invalidation level.
Trade setup with entry, exit, and invalidation at the exact time is only available for premium subscribers.
NSE COCHINSHIP – Resistance Breakout
NSE COCHINSHIP has been trading above 10 & 35 crosses over and above 50 simple moving averages. ADX of the price has reached to 17. RSI of the at 58.
NSE COCHINSHIP has broken out the resistance level of 865. If the price sustains above 865, traders can trade the following targets: 878 – 891 – 909+. Traders can take the previous day as an invalidation level.
We will update further information for premium members soon.Continue reading
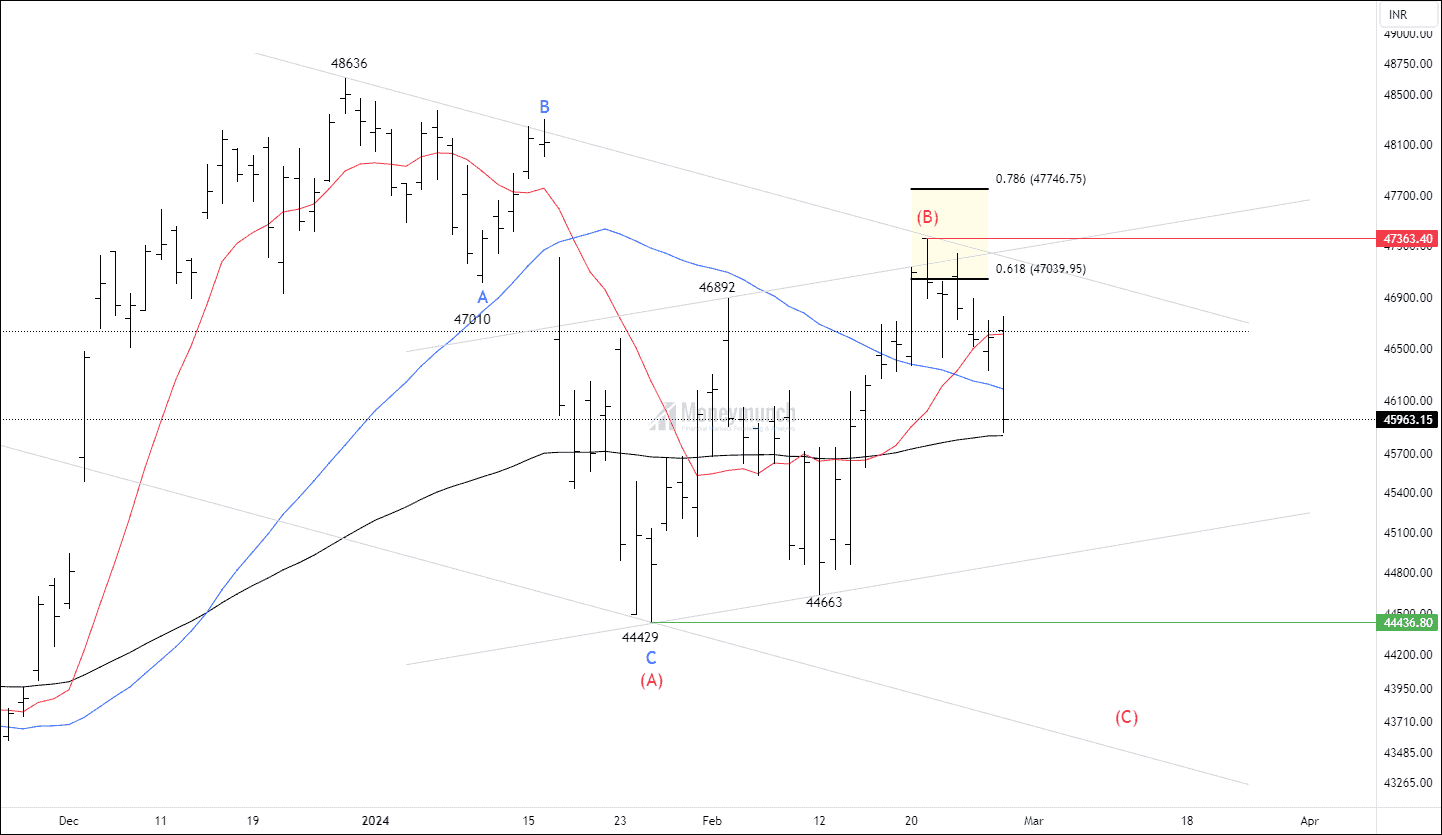
NSE BANKNIFTY & FINNIFTY – Elliott Wave Projection
Timeframe: Daily
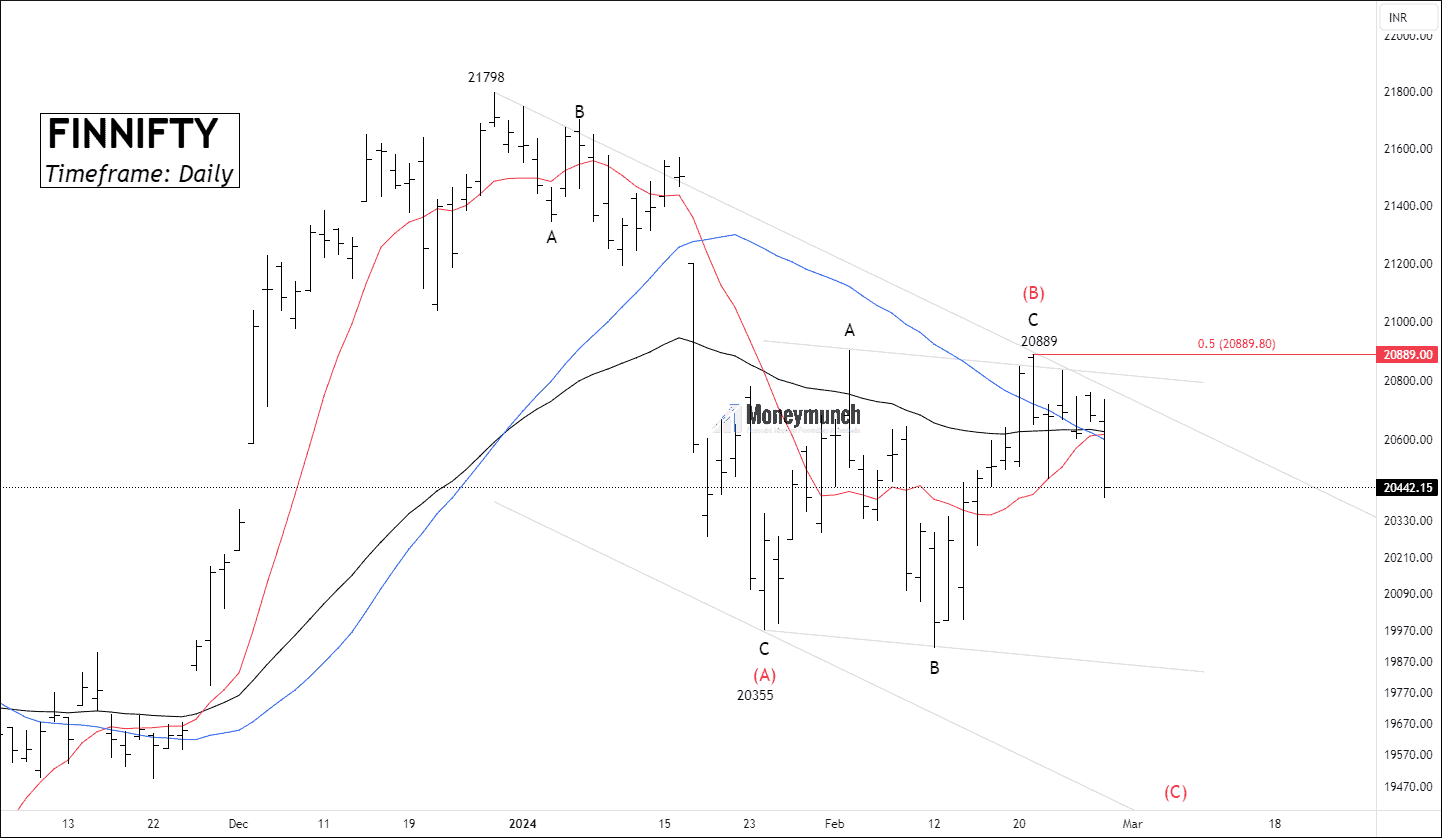
The bank nifty spot has broken down 10/35/50 Moving average and trading at 100 Exponential moving average that spots weakness. From the low of 44429 to the high of 47363, the ADX of the price fell to 15.92.
According to Elliott Wave, the current structure can be labeled A-B-C correction. It’s acceptable to expect a flat as wave B retraced 78.6%.
Alert bulls! There are only two opportunities:
(1) At the lower band after completion of wave C.
(2) Only after the breakout of wave (B).
Wave C can occur near wave the low of (C). sellers can extend targets after the aggressive breakdown of wave C. If the price is falling and reaching too far from the breakdown place, the move can be reliable as an impulsive.
Trade setup with entry, exit, and invalidation is only available for premium subscribers.
 Continue reading
LuxmaTech: NSE’s Bear-Slaying Titan
Do you remember the NSE LUMAXTECH Wave setup?
Click here: NSE LUMAXTECH – Elliott Wave Count
 BEFORE
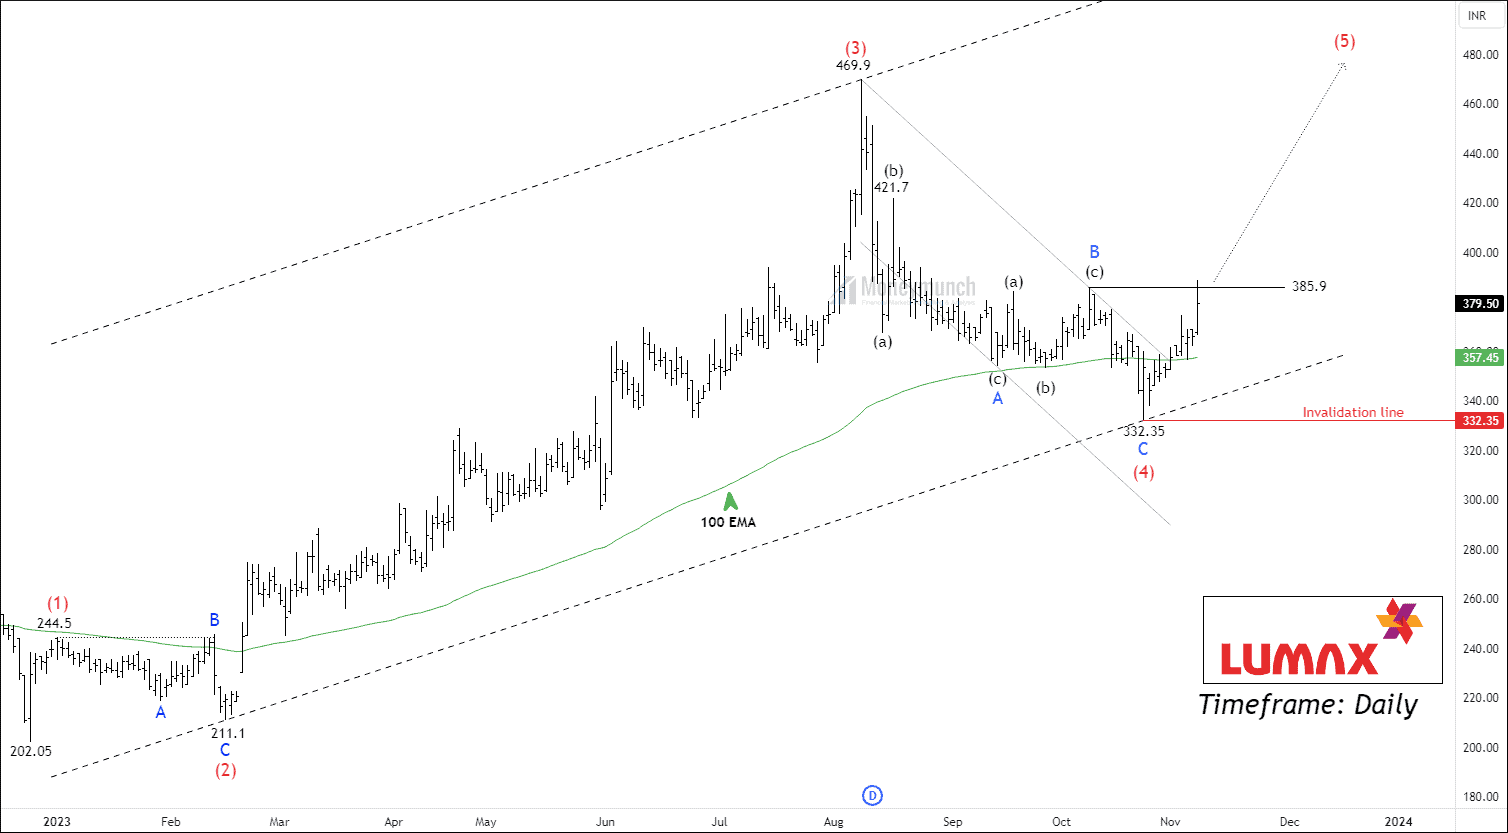
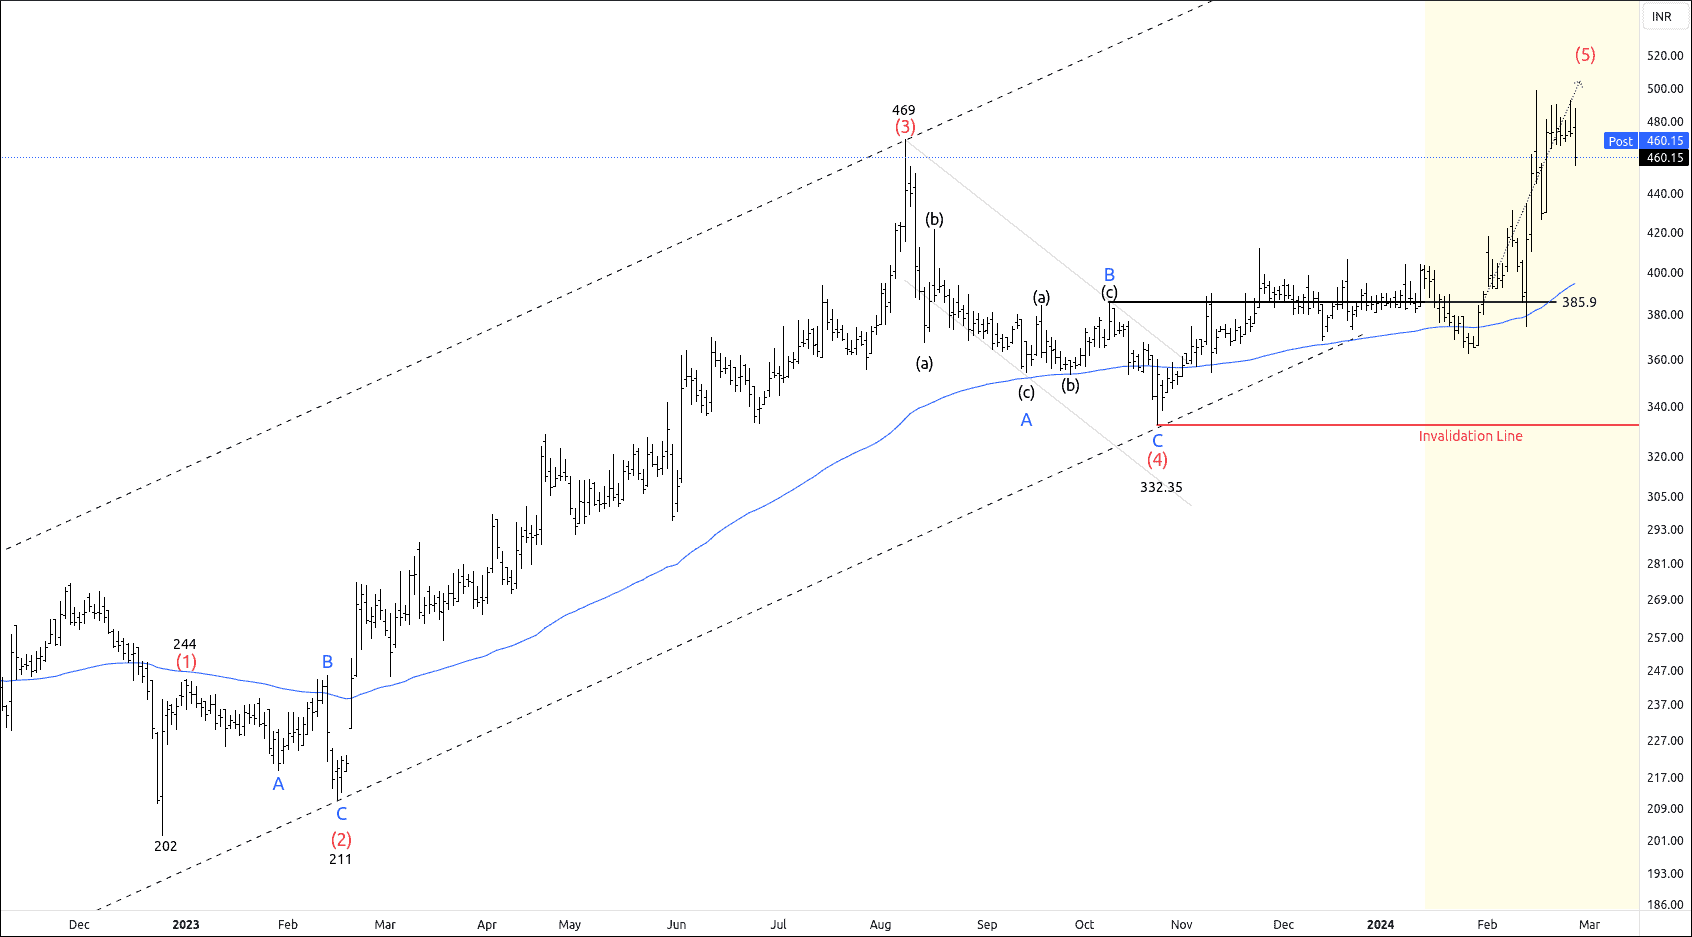
We had written clearly, “Should the price surpass the wave B level at 385.9, traders may consider taking positions with the following price targets: 405 – 421 – 448+”
 AFTER
AFTER
[1 February 2024]
- 09:15 AM – Price touched the first target of 405, and made a new high of 418.
[08 February 2024]
- 09:30 AM – LUMAXTECH hit the second target of 421, and made a new high of 431.
[14 February 2024]
- 12:30 PM – Price achieved the final target of 448.
[15 February 2024]
- 10:15 AM – NSE LUMAXTECH made a new high of 498.
This Setup could generate returns exceeding 28% in just one month.Continue reading
