Free Stock market / Nifty intraday tips, FREE Stock, Commodity & Forex tips

NSE TECHM – High Confidence Research Report

Free nse techm weekly chart calls

Free nse techm weekly chart calls

Timeframe: Weekly

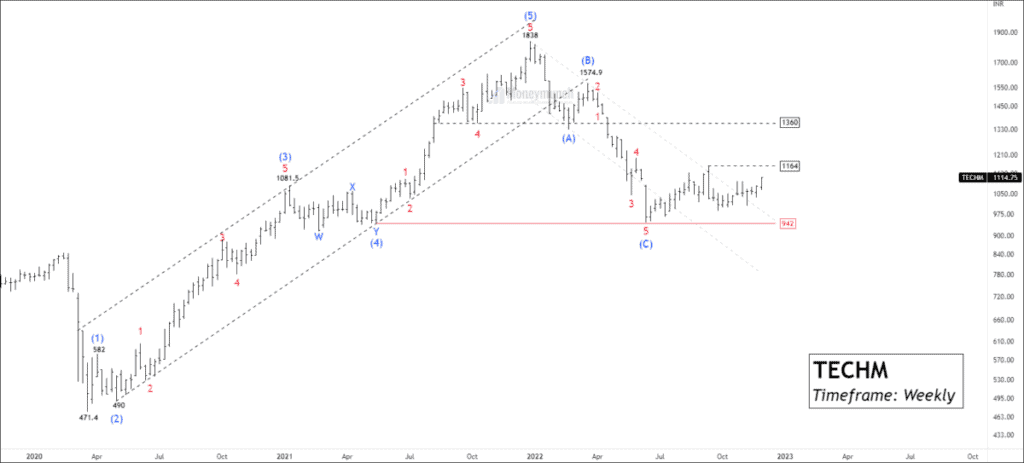
TECHM has made a high of 1838 and completed the impulsive wave (5). It is the ending point of an impulsive wave that marks the beginning of a corrective wave. After the breakdown of the base channel, the price has stated an ABC correction.

TECHM has accomplished an impulsive wave at 943.7 with 2.618% reverse Fibonacci of wave (B) and 1.618% of wave (A). Wave (C) occurred nearby the previous sub-wave 4th at 943.

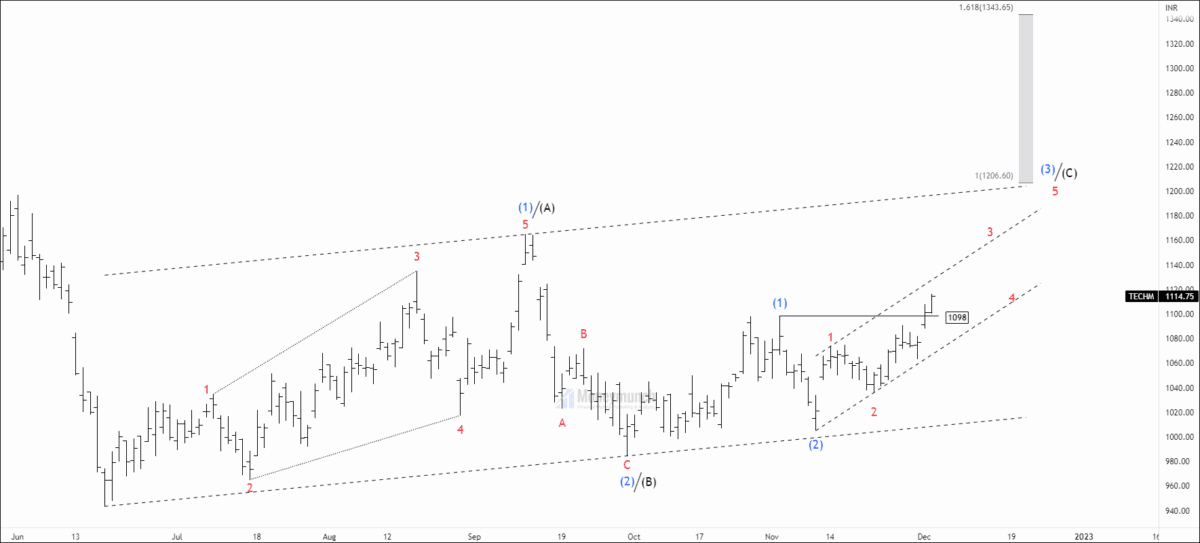
The current price movement is near the recent high of 1164, which represents a resistance level. This level should not be ignored if you have taken a long position. 1164 -1196 is a strong resistance zone that can abrupt upward momentum.

If the price breaks this range, swing/Positional traders can buy for the following targets: 1262 – 1360 – 1436+. Breaks out of the previous high suggest start of an impulsive wave, but the range breakout will be a strong evidence for an impulse. 

Free nse techm weekly head and shoulders calls

Timeframe: Weekly

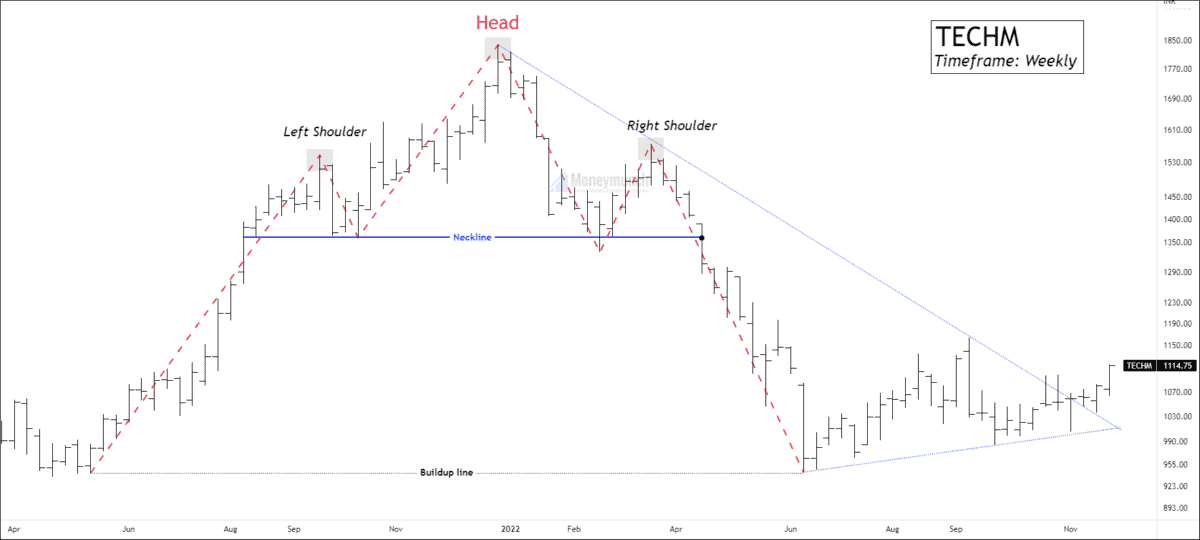
Price has accomplished head and shoulders at the buildup zone. This level will work as crucial support in case of a trend reversal. After this, TECHM broken out resistance line and moving towards recent high.

Most traders use 7, 14, and 21 week EMA to analyze the weekly time frame. Price has broken out 21-week moving averages on weekly basis.This signals bulls are preparing to outnumber bears.

free nse techm daily chart calls

Timeframe: Daily

For Day traders:
(To become a subscriber, subscribe to our free newsletter services. Our service is free for all.)

Get free important share market ideas on stocks & nifty tips chart setups, analysis for the upcoming session, and more by joining the below link: Stock Tips

Have you any questions/feedback about this article? Please leave your queries in the comment box for answers.

Disclaimer: The information provided on this website, including but not limited to stock, commodity, and forex trading tips, technical analysis, and research reports, is solely for educational and informational purposes. It should not be considered as financial advice or a recommendation to engage in any trading activity. Trading in stocks, commodities, and forex involves substantial risks, and you should carefully consider your financial situation and consult with a professional advisor before making any trading decisions. Moneymunch.com and its authors do not guarantee the accuracy, completeness, or reliability of the information provided, and shall not be held responsible for any losses or damages incurred as a result of using or relying on such information. Trading in the financial markets is subject to market risks, and past performance is not indicative of future results. By accessing and using this website, you acknowledge and agree to the terms of this disclaimer.
Previous ArticleNext Article
Mr.Guru(s) is a team of stock market certified technical and research analysts with over 20 years of experience. They are regular guests on popular online channels and contribute articles to several financial publications. Their insights and advice are respected by investors worldwide. With their collective knowledge and expertise, they have a proven track record of successfully predicting market movements and identifying profitable opportunities.

Join Today (Free): Stock & Nifty Tips

3 Comments

Write a Comment

Comment Policy: We love comments and appreciate the time that readers spend to share ideas and give feedback. However, all comments are manually moderated and those deemed to be spam or solely promotional will be deleted. Your email address will not be published. Required fields are marked *