Price Action Perspective:
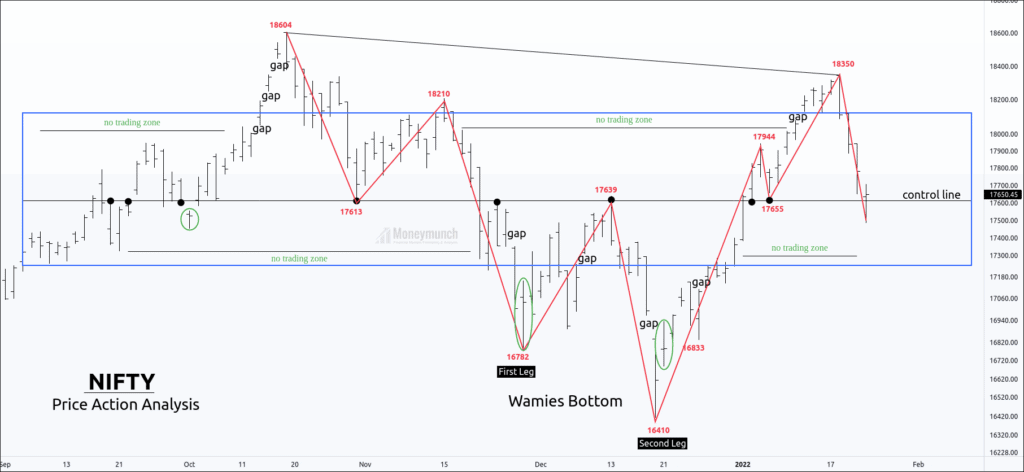
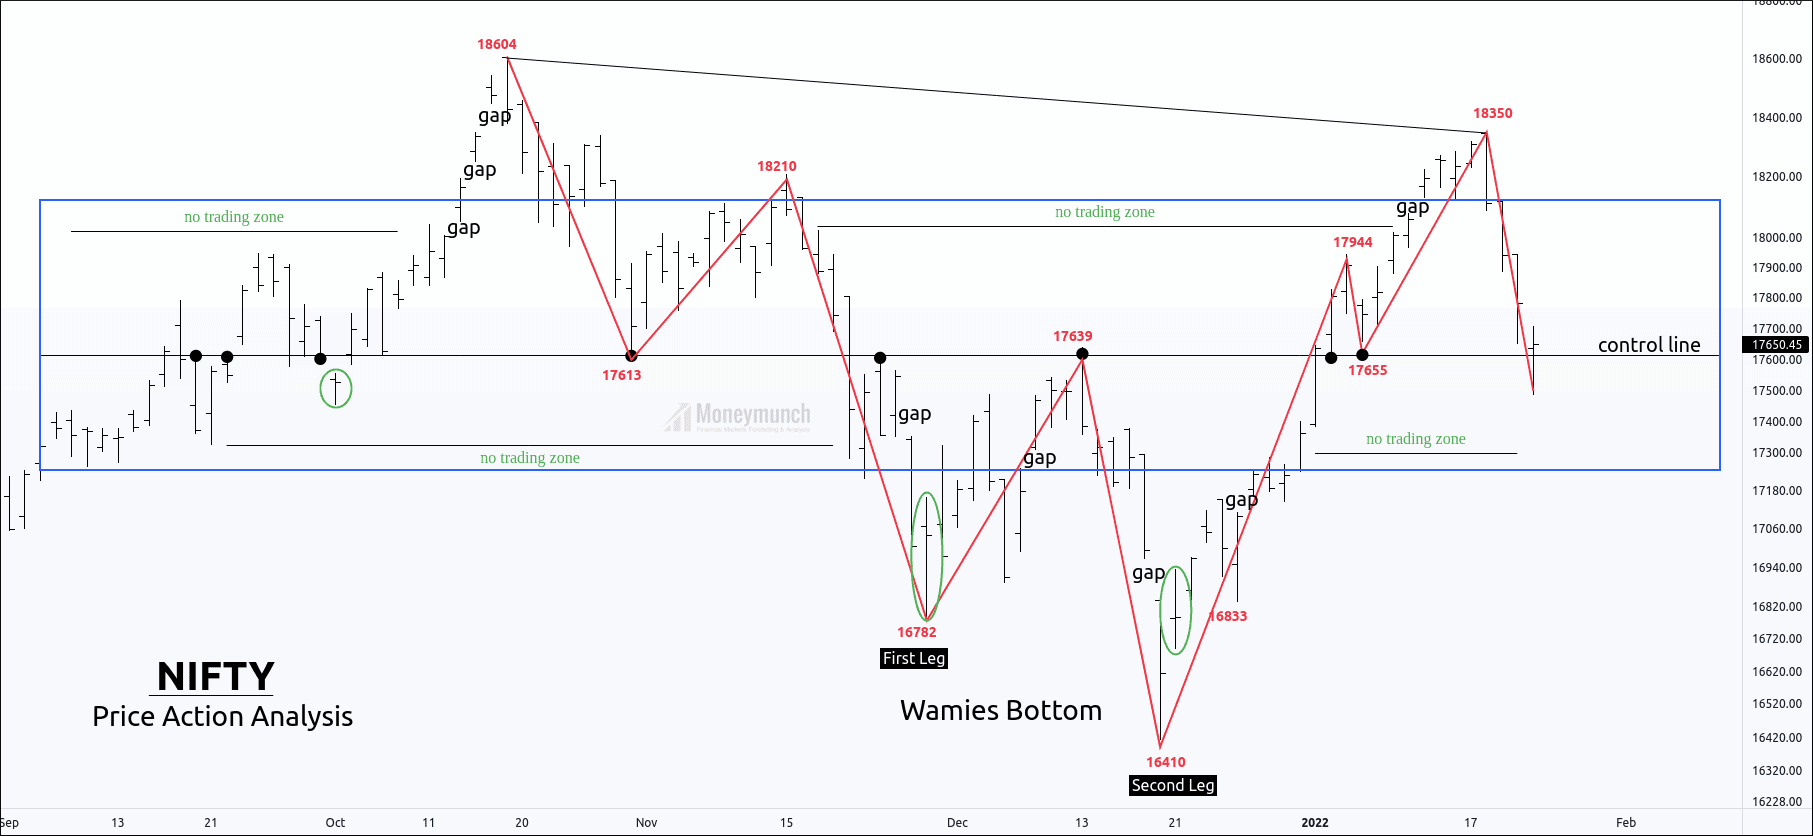
Price is creating a value area where supply and demand are equal.
The control line of the value area has provided eight price touches to confirm the price move, and it has provided five reversals.
In this view, Nifty is on the control line of the value area at 17615. Price has drawn a doji candle on the control line.
There are seven pieces of evidence of a reversal on the control, so the level of 17615 becomes a key level for traders.
In addition, nifty often gives a gap-up after every powerful doji candle. If it has the potential to reverse the price, nifty can reverse with gap-up. (You can see green circles in the chart)
Conclusion:
If Nifty could not sustain above the control line, it would start a downward movement till the lower band of the price area. Price seems strong above the control line, and if the price sustains above 17614, we may see a low 17760-17914-18123+.
Important scenario to look at:
Global Scenario:
– Interest rate hike on the card;
– QE is ending;
– Tapper is in plan;
– Earnings are not as expected;
– Demand getting slow;
– Uncertainty in Russia to US over Ukraine;
– KSA and Yemen issue; and
– Many of growth stocks in US are at 52W low; and
– (Minus) 4.1 World GDP
Indian Scenario:
– Reliance shows exception results;
– IT disappointed;- Banking Insurance Realty doing fine;
– Budget is on the cards. Further, it is expected great expending by the GOI in projects to boost economy.
– GOI to push Make in India;
– FII selling DII buying (SIP and Retail participants investing)
To become a subscriber, subscribe to our free newsletter services. Our service is free for all.
Get free important share market ideas on stocks & nifty tips chart setups, analysis for the upcoming session, and more by joining the below link: Stock Tips
Have you any questions/feedback about this article? Please leave your queries in the comment box for answers.


Thank you for sharing your amazing work with us.
I agree with this chart. Thank you for sharing with us.
Lovely. Great you found earlier Kellton chart. It’s a nice stock to trade-in. Thanks for posting your view.
quite impressive . .
Loved your analysis, plz guide where to learn or read about different kinds of patterns, how to identify them and possible percentage rise of the price if they form, what is midterm MA, etc
let see tomorrow closing
Good Analysis. Thanks for sharing
Very relevant details in TA
Food for thought analysis, keep up the job
Looks good to me.
, Interesting view.
I love how I took the same trade for different reasons :D Not sure about my setup tho, I didnt go in heavy yet, waiting for the MACD to cross, then I will move in with a bigger size.