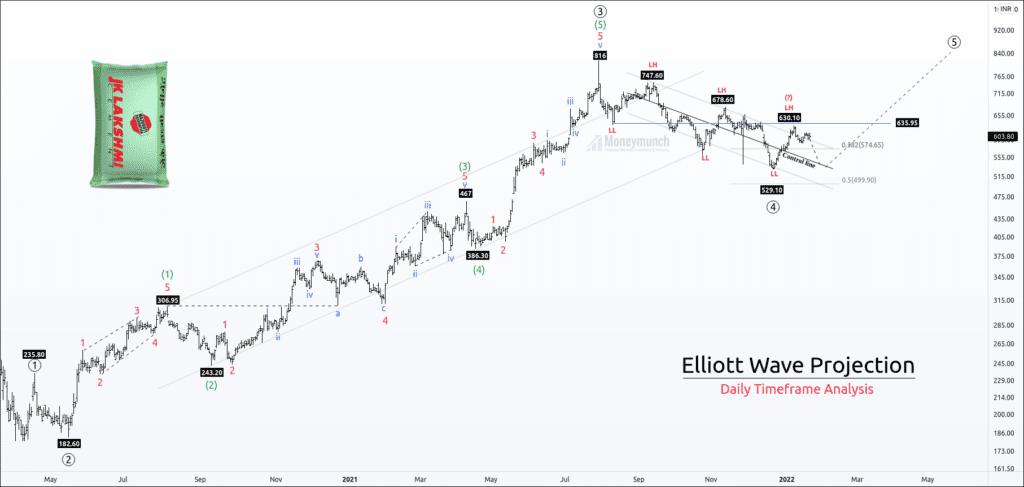
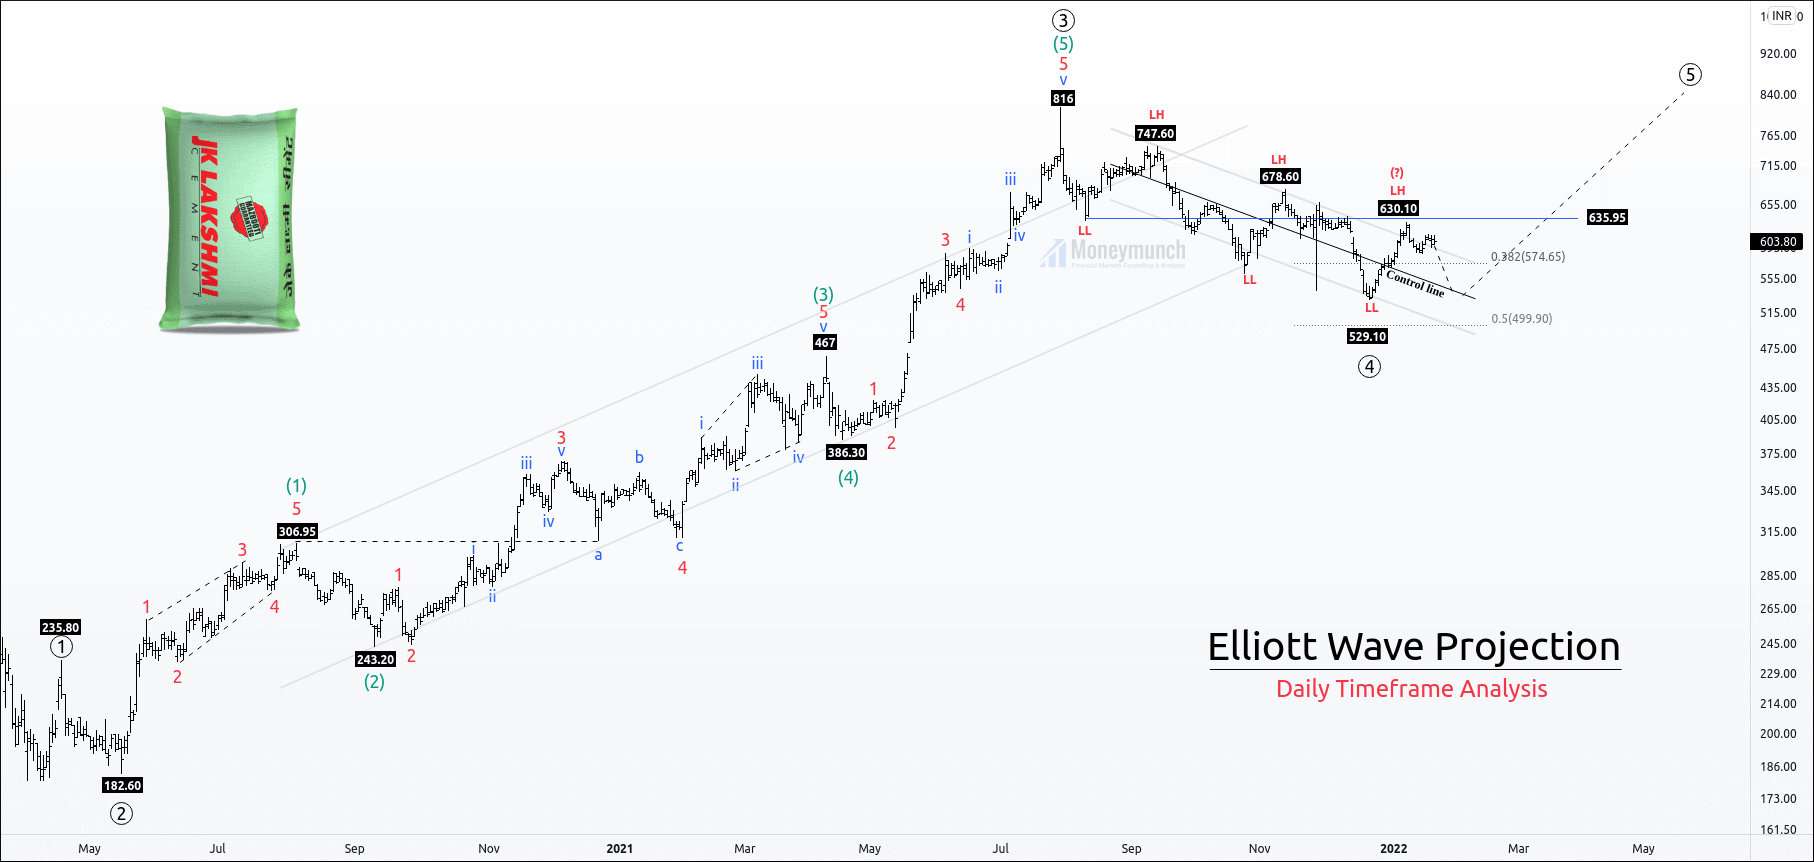
JK Laxmi cement has accomplished impulsive wave ((3)) and has a complex correction of wave ((4)).
After making a high of 816, the price started forming a corrective channel for wave ((4)).
It has made a low of 529.10, and we can see a price surge to 630.
However, the price reached the upper band of the channel, but it is facing dynamic resistance of the parallel channel.
If the price does not break the parallel channel, we will consider it a lower high(LH).
Wave (4) retraced 38.2%, which is the common retracement.
Before starting a bull trend, the price will create public participants, which can be possible after a retracement. Retracement is nothing but a pullback for bull traders.
If the price rejects from the upper band of the channel, it can come down to 61.8- 78.6%.
After the rejection, if the price reverses from the control line, trader can initiate a buy position for 580-635-678-700+
Note, Safe traders should buy after the clear breakout of the parallel channel. We are not interested in buying before a new lower high, which gives a signal of demand zone.
Breaking down the control line will create a new lower low, which can go up to the upper band or 50%- 61.8%.
To become a subscriber, subscribe to our free newsletter services. Our service is free for all.
Get free important share market ideas on stocks & nifty tips chart setups, analysis for the upcoming session, and more by joining the below link: Stock Tips
Have you any questions/feedback about this article? Please leave your queries in the comment box for answers.
This chart is a master’s work.
I am happy to see your Elliott wave analysis.
It’s far better than so-called indicator traders.
Fantastic work. Simple and Easy Explanation
Thats so wonderfully elaborated and yet in so simpler words, umpteen thanks for this !!
very nicely explained in short and sweet manner
looking forward systematic selection of sector and stocks.
Encouraging the confidence of novice traders. Excellent, keep going
You are literally the best.
Its just superb :) Thanks much for sharing such content
Helpful.. Thanks a lot.
Great call on Kellton