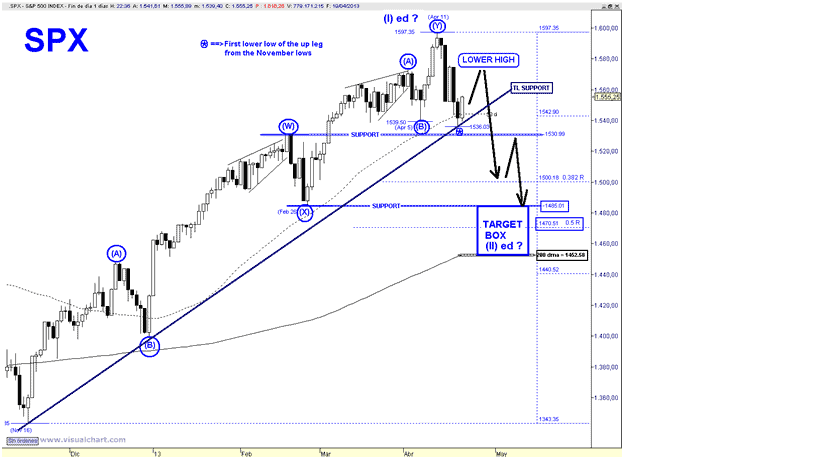
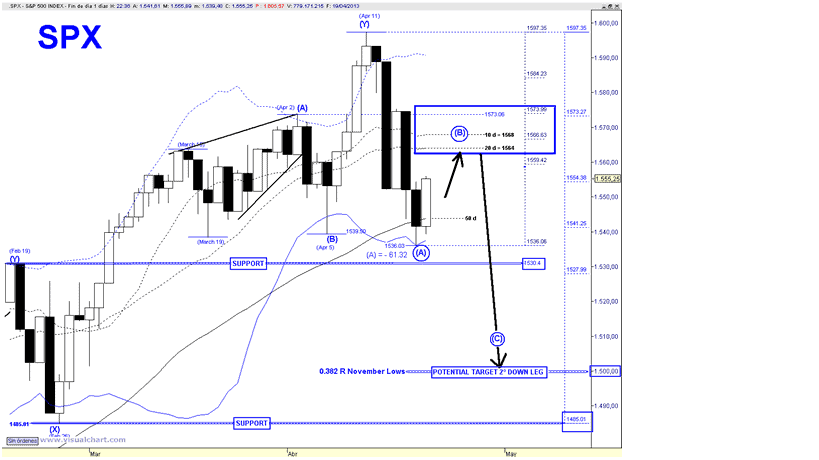
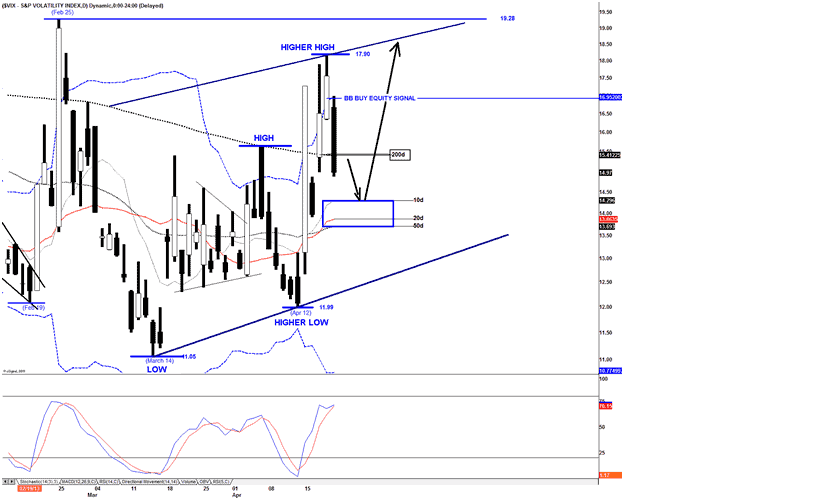
S&P 500 Panic Coming!

The TV pundits all contribute their fair share to the conditioning process by clouding thoughts of any market player. To the extent that all ambiguities presented will bait investors to thinking IRRATIONALLY! Like, waiting for a 1000 point rally to emerge once the fiscal cliff is resolved.

Fortunately, underneath all the headlines a visual and graphical interpretation can be mathematically extracted. It is here, in these very charts, where you will find an answer that illustrates what is really going on, so that us technicians can observe, scrutinize, and formulate a particular bias.

The information provided does not tell you why, or when, but what!

In this case, ‘the what’ is a bear market rally. These particular rallies are very sneaky and most convincing, but can be properly identified when using the right tools.

For starters, a basket of heavily weighted companies, ‘THE NIFTY FIFTYs,’ which offer the bulk in the performance in the averages -all now have chart patterns that cannot sustain the continuation of this advance. Invariably, when volume remains light during an extended window of time, the result is an inevitable sharp collapse back downward to the previous lows or worse, new lows that can no longer support a bull market.

The S&P 500 index is a case in point, which is still in rally mode, and perhaps can continue higher if there is further consolidation. But if only mother market is ever so accommodative to our own expectations.

And it is because of her complexities that make it an impossible arena for perfection. The current rally back is clearly overworking itself to recapture the previous drop in November and rather than guessing where exactly it will end, think of it in terms of direction. The future course of these violent counter trends ultimately end in a scare plunge; and all the pumping in the world cannot uphold the violent cascade of selling pressure that will implode on the masses.

Consider the technical chart below, which projects a disaster waiting to happen, and with only a small chance of one last leg higher before this rally is all said and done.

S&P 500 – Daily Chart

SP-500-PanicTo become a subscriber, subscribe to our free newsletter services. Our service is free for all.
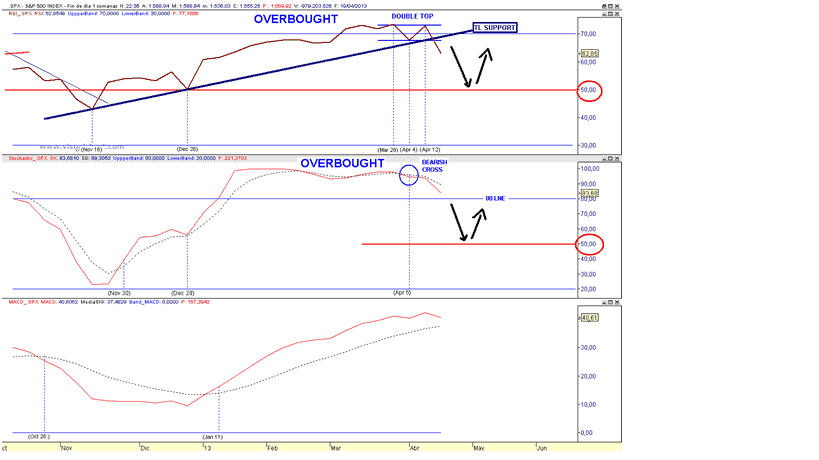
Continue reading

S&P 500, Inverse “Head and Shoulders” Pattern Continues to Play Out as Heavy Week of Economic Data Begins

The first week of the month is always the most interesting, with global purchasing managers indexes, U.S. ISM’s, and employment data released.  Overnight we see continued weakness in Europe’s economic data and perhaps some more “green shoots” in China.   Europe is sporting “beige shoots” at it is reaching the stage where things are so bad it is difficult to go down further.

  • Euro-zone manufacturing activity contracted for the ninth consecutive month in November, albeit at a slower pace than in October. Markit’s Eurozone manufacturing Purchasing Managers Index (PMI) rose to 46.2 in November from October’s 45.4, though it stayed below the 50 mark dividing growth from contraction for the 16th straight month.
  • The new export orders index was revised up to 46.4 from the preliminary reading of 45.9 two weeks ago, and it now reads more than a full point higher than the October reading.
  • Manufacturing accounts for around a quarter of the euro zone’s private economy and is dwarfed by a services sector that fared badly in November, the data two weeks ago showed.

China seems to be “recovering” not due to the private sector, but government led:

  • The final reading for the HSBC Purchasing Managers’ Survey (PMI) rose to 50.5 in November from 49.5 in October, in line with a preliminary survey published late last month. It was the first time since October 2011 that the survey crossed above 50 points, the line that demarcates accelerating from slowing growth.
  • An official PMI survey of China’s non-manufacturing sectors also ticked up, to 55.6 in November from 55.5 in October, led by expanded activity in construction services. But growth in air and rail transport and food and beverages both slowed.
  • Growth accelerated for large firms for the third month in a row, but medium and smaller companies saw a retrenchment, with the decline more pronounced for the smaller firms, the NBS said in a not accompanying its official manufacturing PMI survey. “The improving numbers are mostly because of government investment,” said Dong Xian’an, economist with Peking First Advisory, referring to the official PMI.

As for the U.S. we have ISM Manufacturing this morning at 10 AM; consensus for 51.7 – flat with last month.  Construction spending also hits at 10 AM – expectation 0.4% growth.

Wednesday ADP employment which hopefully with some recent changes is “somewhat” closer to government data on a month-to-month data (before revisions) – expectations of 125K versus 158K.  Sandy should be an issue.  ISM Non Manufacturing, expectations of a drop to 53.6 versus 54.2.

Friday is the much watched (Jack Welch) employment report – expectations of only 80K versus last month’s 171K, again Sandy impacts here.  Unemployment rate expected up to 8.0% versus 7.9%.


As for the technical picture, we have a gap up this morning on any myriad of “positive” news items – China PMI (despite China stock market falling yet again), European PMI not getting worse (European markets acting WELL), or Spain asking for bailout funds for its banks (no surprise, but algos read the headline and futures popped).  Evidence continues to mount for a continuation of an inverse “head and shoulders” bottom move; if this continues there should be a move to the mid 143os to upper 1440s (depending on what you use for the head and neckline – up for some interpretation).   Now if that happens this would create the first “higher high” in the S&P 500 since the correction began in mid-September, but if that is all the move has in it would be a particularly nasty spot to reverse since everyone would say “a new high” and the trend is changed.   But we’ll see – this market has become famous since 2009 for “V shaped” moves that continue in one direction (not the boy band) without relent so the talk of “performance chasing” and “underinvested longs” and “repeatedly scarred shorts” should be relentless over S&P 1435.

At the time I write this the S&P 500 is gapping up to the 61.8% retrace of the entire two month correction.  As posted Friday, the ability for the market to move sideways to consolidate gains was a positive – so the corrections in this move up have come mostly via time rather than price.

sp-500-Head-and-Shoulders

Continue reading

S&P 500: Complicated from Here

While things are never easy, the (quote-unquote) obvious trade in the major indexes has now played out, especially on the S&P 500.  Of course most of it happened in an overnight gap up, but that has been par for the course.  From here things get more complicated.  Here are a few ways to look at the roadmap utilizing the S&P 500.

First the original S&P 500 chart that has been in play for months, looking at the June-Sep run, and pullback since.   Two key points here – the index has bounced from the 61.8% retrace to nearly the original 38.2% retrace at ~1395.   That number is also key in that it was support multiple times in August 2012.  Support turns into resistance and vice versa so this 1395 level is a very obvious level to watch.

s-and-p-500

Second, is the chart I posted yesterday morning which is simply the same Fibonacci levels but focused solely on the September-November pullback.  What’s the first number that sticks out?  1394 (call it 1395, close enough for government work).  That is the 38.2% retrace of the two month correction.

s-and-p-500-index

If 1395 is vanquished, the next two levels are 1409 to 1424 which you can see was an area with a lot of traffic in late October to early November before the correction became much more ferocious.   That second number also coincides with a falling 50 day moving average.

Last, on a very short term frame there is a potential for an inverse head and shoulders formation (which favors bulls) in the near term.  The head being Thursday/Friday’s lows and the neckline being about “here” at 1390.   If that does play out, it measures to a target of ~1430.  That would be a 3% move from here.. and still not create a new higher high versus those early November levels.  Hence all that could in theory happen and still bode poorly afterwards.   But either way, one can see all the congestion and push pull in the areas overhead.

Of course all this coincides with positive seasonality, the constant negotiations re: the fiscal cliff, the next round of easing to be announced at December’s FOMC meeting (to replace Operation Twist), and a slowing corporate earnings outlook.

Anyhow enjoy the Thanksgiving holiday and we’ll catch you on the other side.

Continue reading

S&P 500, Dow Jones and EURO

Yesterday SPX fulfilled the script of a narrow range body, it’s the common candlestick (in this case a bearish Hanging Man) that usually follows a white Marubozu. It means consolidation of the previous gains and hesitation.

This pattern could evolve into a bearish reversal pattern ” Evening Doji Star” if today we get a gap down and go. But this is not my preferred scenario.

Regarding the overall count from the September 14 high, I don’t even change a comma, since I remain firmly confident that the current “countertrend” rebound will top in the target box that I have been highlighting in the last few days. Critical overhead resistance is now not far away, either 1397 or a kiss back at the previous trend line support off the October 2011 now converted into resistance.

Once/if price confirms my preferred scenario the last wave (C) down, which could match the length (89.1 points) of the previous down leg; wave (A), is expected to complete the EWP off the September 14 high, hopefully with positive divergences.

For the short term the 10 d mas = 1375.17 could be the demarcation between a mild pullback and something more bearish.

sp-500-price

Regarding the labelling of the current rebound so far we have a 3-wave up leg or a corrective variant (DZZ) therefore we have 3 options:

  • The “oversold” bounce is over ==> the wave (B) is done.
  • Price has established the wave (Y) of a larger Double ZZ.
  • Price has established the wave (A) of a larger Zig Zag.

So we need to see the internal structure of a pullback in order to increase the confidence on a count.

For the immediate time frame yesterday’s down leg after completing an Ending Diagonal suggests that there should be at least one more down leg.

sp index

As I mentioned yesterday I am watching:

1. EUR: “Since in my opinion the internal structure of the rebound off the November 13 lod is clearly suggesting that in the near future price has more business to the down side. So far bulls here are struggling to reclaim the 200 d ma, which coincides also with a strong horizontal resistance, while slightly above there is the steep declining 20 d ma. Barring “good news”, with the current weak structure, which could be shaping a bearish Flag, price should reverse in the range of the Trend line resistance in force since the October 17 high and the next horizontal resistance at 1.2876″.

So far price is maintaining the sequence of higher lows hence if price breaks above 1.2840 (trend line resistance off the October 17 high) then within the corrective pattern in progress price could extend the move towards the next resistance located at 1.2876.

euro

2. VIX: we now have to watch the trend line support and the possible “sell equity signal” that would be issued with en eod print above the Bollinger Band of the Envelope > 15.50.

Yesterday’s doji + oversold Stochastic are favouring at least a bounce attempt, although ahead of Thanksgiving holiday it may not be a reliable indicator.

sp-500-vix

I wish a wonderful Thanksgiving to US readers.

Continue reading

Fiscal Cliff Navigation Tactics

Nov 20, 2012

  1. Earlier this year, Goldman Sachs’ Peter Oppenheimer said that compared to bonds, US stocks were the cheapest in 50 years.
  2. If Peter is correct, that could be good news for your gold stocks, because there is an ongoing correlation between the Dow and most gold equities.
  3. Unfortunately, Goldman also believes that the fiscal cliff situation could drive stock markets 8% lower by year-end.
  4. You are looking at the daily chart for the Dow, and you can see that it made a small top in mid-September. It has declined about 8% from the high.
  5. Gold stocks are more volatile than the Dow. GDX declined about 18%, during the period in which the Dow fell 8%. There is a lot of symmetry between these two charts.
  6. If the Dow is set to fall another 8% from the lows of last week, GDX could fall another 18% from its recent lows. That would put GDX at about $37, and below the May-July lows.
  7. Some of the largest gold companies are already trading near their summer lows, which is somewhat alarming.
  8. If you own a home, it is wise to purchase home insurance. If you own gold stocks, carrying some cash and short positions is a form of insurance. That’s the daily chart of DUST, which is effectively a triple-leveraged bet against GDX. The performance is calculated on a daily basis. I’m a buyer, moderately, in the $28 and $22 areas.
  9. What would happen to gold stocks, if Goldman Sachs is correct about the Dow falling another 8%, and then they called for an even harder fall, instead of a rally?
  10. The situation could get quite ugly. A small position in DUST may help gold stocks investors to professionally manage fiscal cliff fear.
  11. Gold recently sold off along with the other so-called “risk on” markets, but it bottomed quickly. The daily chart shows a nice head and shoulders bottom pattern in play.
  12. The daily gold chart looks superb. The H & S pattern sits near the demand line of a beautiful rising channel.
  13. HSR (horizontal support & resistance) at $1758 is the initial upside target, and then $1800. A “price pop” to the $1825 price zone could be a game changer for gold stocks.
  14. Silver looks even better than gold. Yesterday’s price action was important, because it took silver above the neckline of a head and shoulders bottom.
  15. At this point in time, gold has yet to rise above its neckline, so silver is clearly the leader.
  16. Silver seems eager to race to $35.50, and if gold can rise above $1800, that could catapult silver into the $40 range.
  17. There’s more good news. Ben Bernanke makes a speech in New York today, and he may give more hints about ramping up QE3. Currently, QE3 is being “diluted”, because the Fed is selling short term Treasuries.
  18. There are rumours that the Fed may cut back on that practice, or even halt it, before the end of the year. If “Big Ben” speaks boldly about ending the dilution of QE3, gold and silver could spike higher, very quickly.
  19. Most investors in the gold community like speculative resource stocks. If you are looking for action, my favourite play right now is the “Global X Gold Explorers” fund.
  20. At about $8 a share, the GLDX ETF is something that is probably priced “just right”, for action-oriented investors. In contrast, GDXJ is trading at about $22.
  21. It’s a lot easier to look down from $8, than it is from $22. Aggressive investors should considering accumulating GLDX on every 25 cent decline, inside the highlighted $7-$9.75 “price box”.
  22. I like both GDXJ and GLDX, but there’s no question that GLDX is a lot easier to handle, emotionally.
  23. A move above $1800 in gold could be the catalyst that takes GLDX above $10. From there, the target would be $13, which is about 50% higher than today’s price!

Gold and Silver Trading Tips Report

gold-spot-price3

Gold-and-Silver

Arguments for lower prices:

  • 3rd attempt (within 11 months) to take out heavy resistance around US$1,790.00-1,800.00 failed and Gold clearly broke down from bearish wedge in October
  • COT Data again pretty bearish for gold and silver
  • Mining Stocks crashed down through support and 200-MA
  • US-Dollar in short term uptrend since mid of september, so far no clear trend reversal
  • Recession in Europe, slower demand from China and India

Arguments for higher prices:

  • Gold & Silver bounced impulsively from oversold levels. This price action has a very bullish character.
  • Gold clearly above 200-MA (US$1,665.66)
  • Reversal at Fibonacci retracement, this confirms “correction” within uptrend
  • Gold/Silver ratio heading lower again, creates MACD buy signal for precious metals
  • Longer term Gold in similar correction pattern like 2008/2009. Breakout to US$2,000.00 expected to happen in summer 2013
  • New uptrend in precious metals since august 2012 that should carry gold up to US$1,850.00 and 1,900.00 until spring 2013.
  • US-Dollar Death Cross (long-term 200-MA broke above its short-term 50-MA in mid of october). This signals dollar weakness!
  • November very bullish seasonals. Seasonality until spring very promising.
  • Never fight the FED. Unlimited QE -> money printing all over the world will push asset prices in all sectors higher…
  • Throughout history, periods of massive money creation have always been inflationary and this time should be no different.
  • Santa Claus/Year End Rally has probably started yesterday
  • massive tension and escalation in middle east (Israel & Gaza, maybe Egypt and other states to get involved ?)

Conclusion:

  • After the initial impulsive bounce from oversold levels Gold has been consolidating between US$1,740.00 and US$1,705.00 in a bullish fashion. Now Gold looks ready to break out above US$1,740.00 very soon. This breakout will start a heavy wave of buying/short covering and should bring gold very fast to next resistance at US$1,790.00 / US$1,800.00. Here another setback must be expected. Overall I continue to believe that Gold will move up to US$1,850.00 and around 1,900.00US$ until spring 2013.
  • Any break below US$1,705.00 and especially US$1,696.00 would be very bearish but is not expected.

Long term:

  • Nothing has changed
  • Precious Metals bull market continues and is moving step by step closer to the final parabolic phase (could start in 2013 & last for 2-3 years or maybe later)
  • Price target DowJones/Gold Ratio ca. 1:1
  • Price target Gold/Silver Ratio ca. 10:1
Continue reading