
Commodity Report: MCX Gold, Silver, Guinea, Oil, Mentha Oil, CPO, Castor Seed and more

MCX Silver and Gold have been rising in current weeks. The stock market and commodities have been rising recently in anticipation of a move by the Fed. The economy is still struggling plus most feel this shell game will maintain for a long time. If you watch the stock market, you can see a pattern of a slowly churning higher market. It is almost a 45 degree angle higher climb with a very tight range. This is point that the market will continue higher and you don’t want to fight it. The big players are controlling the market and they know what they’re doing. Crude oil could easily churn higher to the $100 level in the near future. Until sentiment in the market changes, you want to go with the flow. The stock market is the main indicator and the oil market will follow along.

mcx-gold-guinea

Anyway, today I think MCX Gold and Gold Guinea both looking upside. Intraday traders have must eye on Guinea. It’ll kiss 24078-24101. What about Gold? I’ll write soon.

mcx mentha oil

I see good opportunity for small traders in Mentha Oil. Yep, yesterday our subscribers minted money from it but today I think to pass for everyone. Remember, it small piece is unsafe. Targets: 1348-1356

mcx cpo

From past 2 months, MCX CPO is jumping like monkey and everyone know monkey is monkey. That’s why I’m not going to write more about it. Targets: 556.5-558

ncdex-castor-seed-oil

Lion Heart traders, open you heart now and Go with NCDEX Castor Seed flow. Targets: 4345-4366-4382

You want to know more about Gold, become a subscriber, subscribe to our free newsletter services. Our service is free for all.

Continue reading

Is this the rally… Nifty? S&P 500 Index

rally-end-sp-500-index

Enough fireworks to chase away many retail investors. Equity fund outflows have been heavy, the highest in two years. Yet the S&P 500 is also up nearly 11% from its June low and is now pushing over the 1,400 level for the first time since late April.

Now the question is: Will it last? And where should investors arriving late to the party focus their attention?

  • The economy is in poor shape with GDP growth slowing to just 1.5% in the second quarter.
  • The unemployment creeping back up to 8.3% last month.
  • Stocks and risky assets — especially commodities — have been moving higher over the last few days

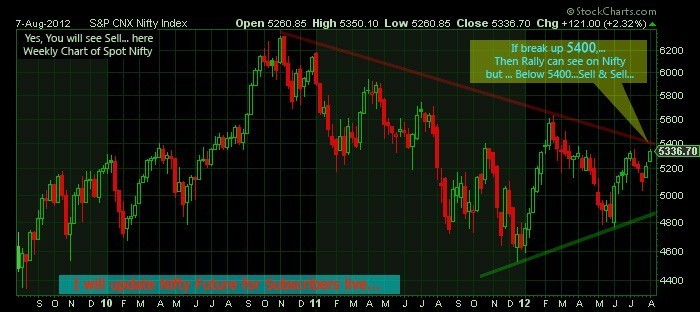
nifty-future

Do you also Think for same in Nifty? Yes, you will see very soon… To become a subscriber, subscribe to our free newsletter services. Our service is free for all.
Continue reading

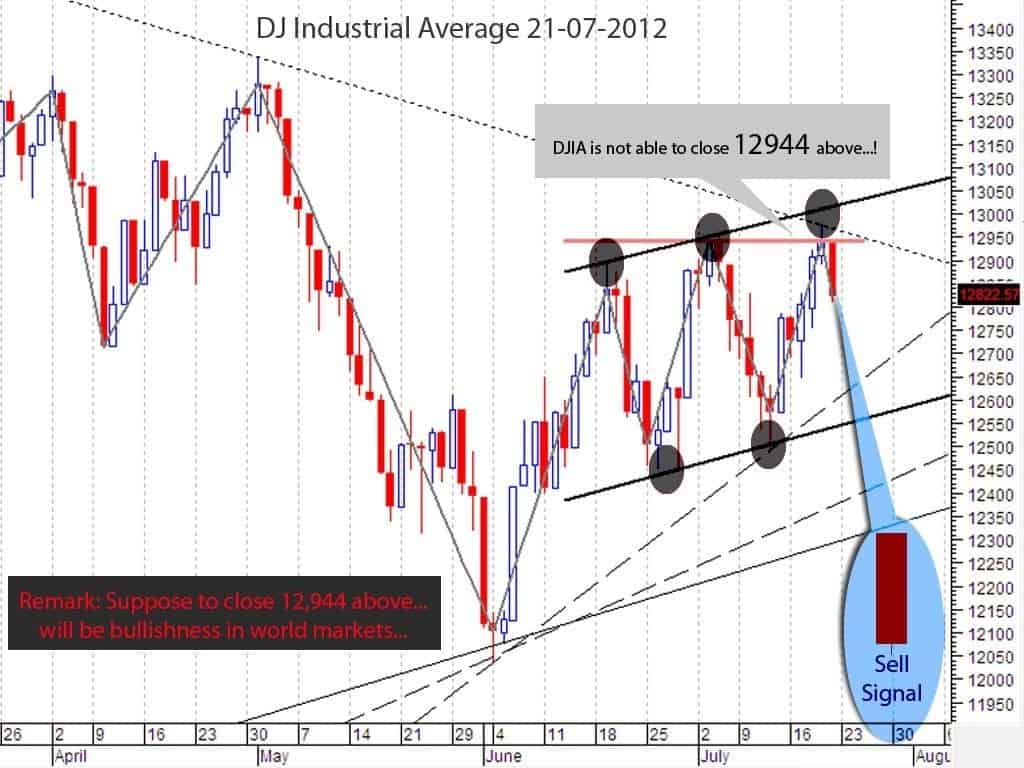
Dow Jones Chart Updated for 22-7-2012 (Weekly View)

Dow Jones trading at resistance of flag pattern but last trading secession was clearly sign of sell on Friday which was long bearish candle. You can see easily 12731.

Suppose to close it above this resistance, then market will be fire!

To become a subscriber, subscribe to our free newsletter services. Our service is free for all.
Continue reading

Flag Trendline SP500 Update

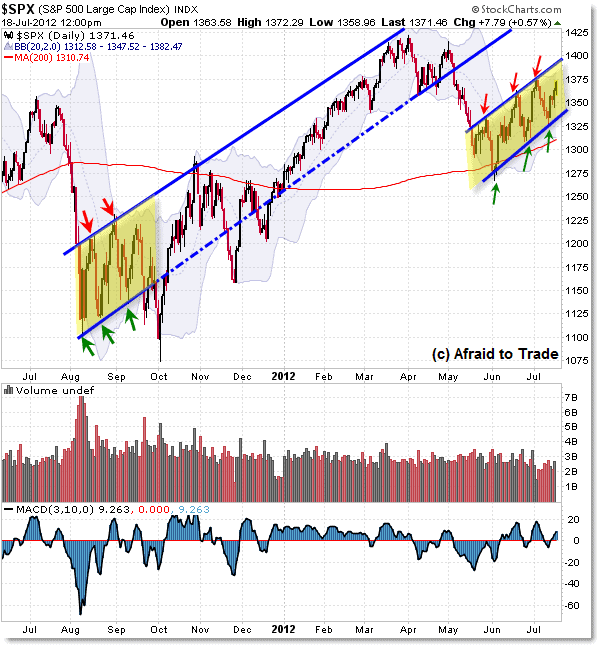
We’re hearing much talk about the potential Bear Flag pattern on the S&P 500 Daily Chart.

Let’s take a mid-week update on the pattern and note the current key price boundary levels to watch for clues.

First, here’s the S&P 500 Daily Chart trend-lines structure:

SP-500-Daily-Chart

Moving from right to left, we see the current “Bear Flag” consolidation pattern stretching from early June to present.

The lower rising trendline resides near 1,340 while the upper rising trendline continues near 1,390.  The 30-min chart below emphasizes these trendline levels.

Now, moving to the left of the chart, the last time we saw a similar Daily Chart ‘flag’ struture was from August to October 2011.

While price did break the downside trendline, the full downside target was NOT achieved due to a power-rally which developed off the 1,100 Index level.

From there, price structure continued to trade mostly in a “Creeper” uptrend, bound by the prior “flag” trendlines until the breakdown of May 2012.

To become a subscriber, subscribe to our free newsletter services. Our service is free for all.
Continue reading

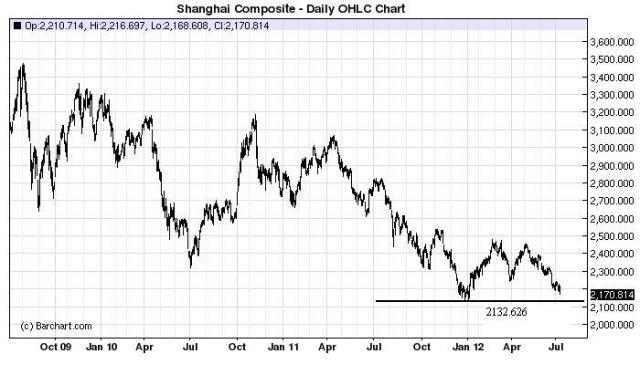
Shanghai Composite reached to Support

Shanghai-Composite

The Chinese government reported imports rose just 6.3 percent last month from a year earlier, less than half the 12.7 percent expected increase. No doubt this reflects softening domestic demand in the world’s second largest economy and one reason why commodities have been selling off.

Don’t you think the government has to be cooking up something big?

To become a subscriber, subscribe to our free newsletter services. Our service is free for all.
Continue reading

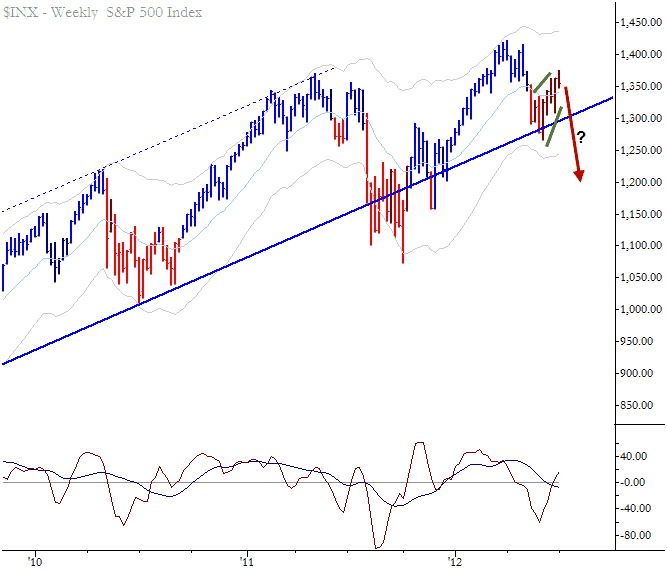
Weekly Market Structure in S&P 500

S&P 500

Note the weekly bear flag on the S&P 500 index. You may call it by a number of different names (wedge, pullback, anti, flag, etc.), but the concept is the same: A period of contracting volatility with an upward bias following a sharp selloff. This pattern could be expected to resolve downward, providing a headwind for bearish trades over the next several weeks. Be aware that weekly patterns can take a long time to play out, and there is plenty of room for upswings on daily and intraday timeframes even if this weekly pattern resolves cleanly. Knowledge of higher-timeframe technical patterns often provides good context for trades on lower timeframes. This is an important part of understanding evolving market structure and potential technical risk factors.

To become a subscriber, subscribe to our free newsletter services. Our service is free for all.

Continue reading