Crude oil, Brent oil, & Aluminium Chartolgy & Next Big Move
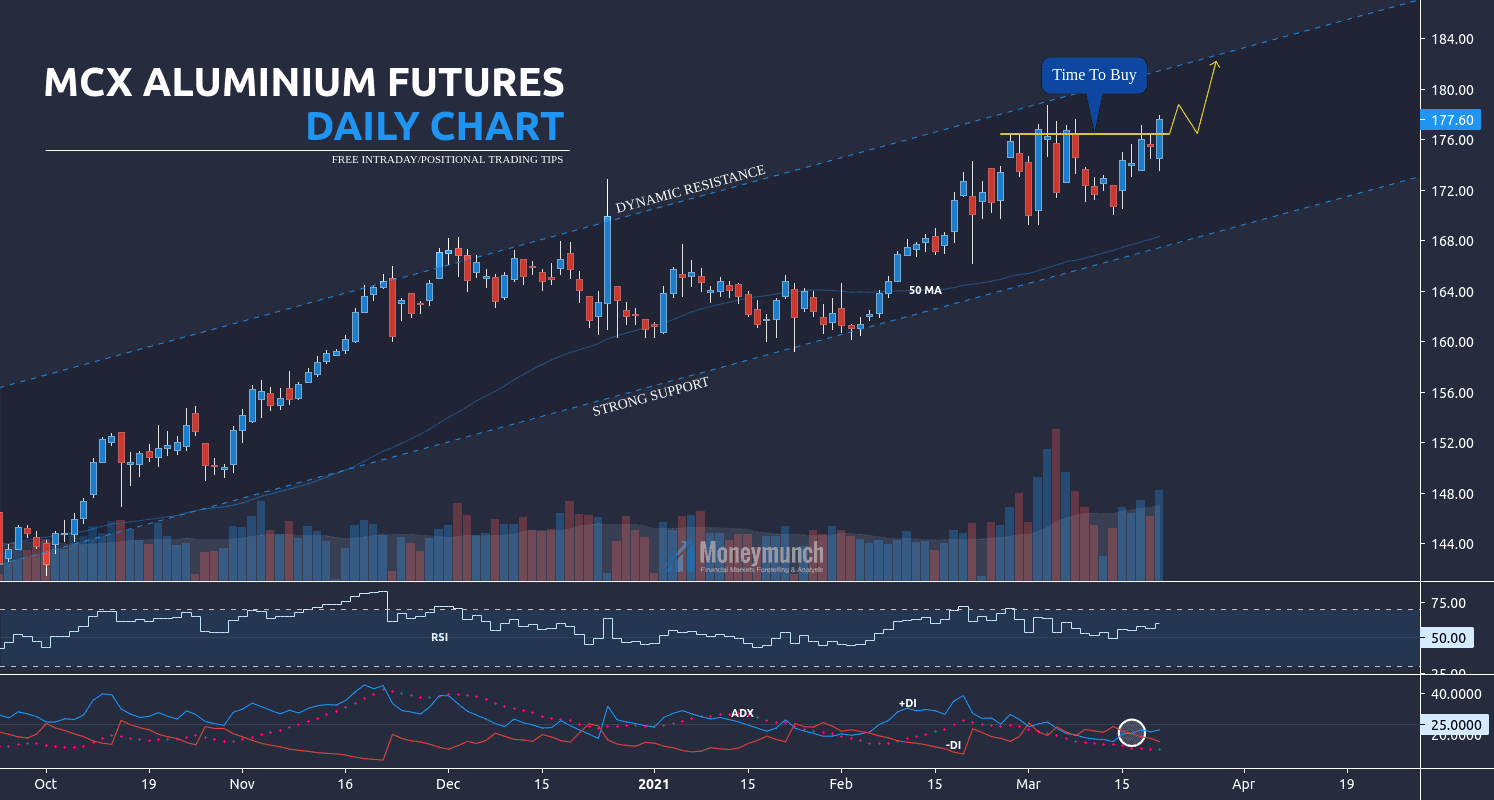
Aluminium Is Close To Something Big
According to this chart, MCX Aluminium can fly from here if it does not close below 176.4 levels.
Targets: 178.6 – 179.6
Short-term targets: 180 – 181.6+
But, if it closes below 176.4 levels, then this call will deactivate. And it will start collapsing for the levels of 174 – 172 from there.

Crude Oil Is Going to Blast – A New Update & Tips
How many of you sold crude oil on the previous Thursday?
Article: MCX Crude Oil & NYMEX Brent Oil In-depth Analysis & Tips
In the previous article on crude oil & brent oil, I said in bold words, “…so, intraday traders can set the following targets to make some money: 4560 – 4500 – 4460 – 4400 | …and, if brent oil breaks the hurdle ($66.60) and shows a closing price below it, we will see a heavy downfall. Targets: $64.6 – $62.8 and below”.
The crude oil has reached all targets! Enjoy!
What next? To become a subscriber, subscribe to our free newsletter services. Our service is free for all.
 Unlock This Article
Only subscribers can read the full article. Please login to read the entire article.
Continue reading
MCX Crude Oil & NYMEX Brent Oil In-depth Analysis & Tips
NYMEX Brent Oil Futures – Simple Trading Strategy
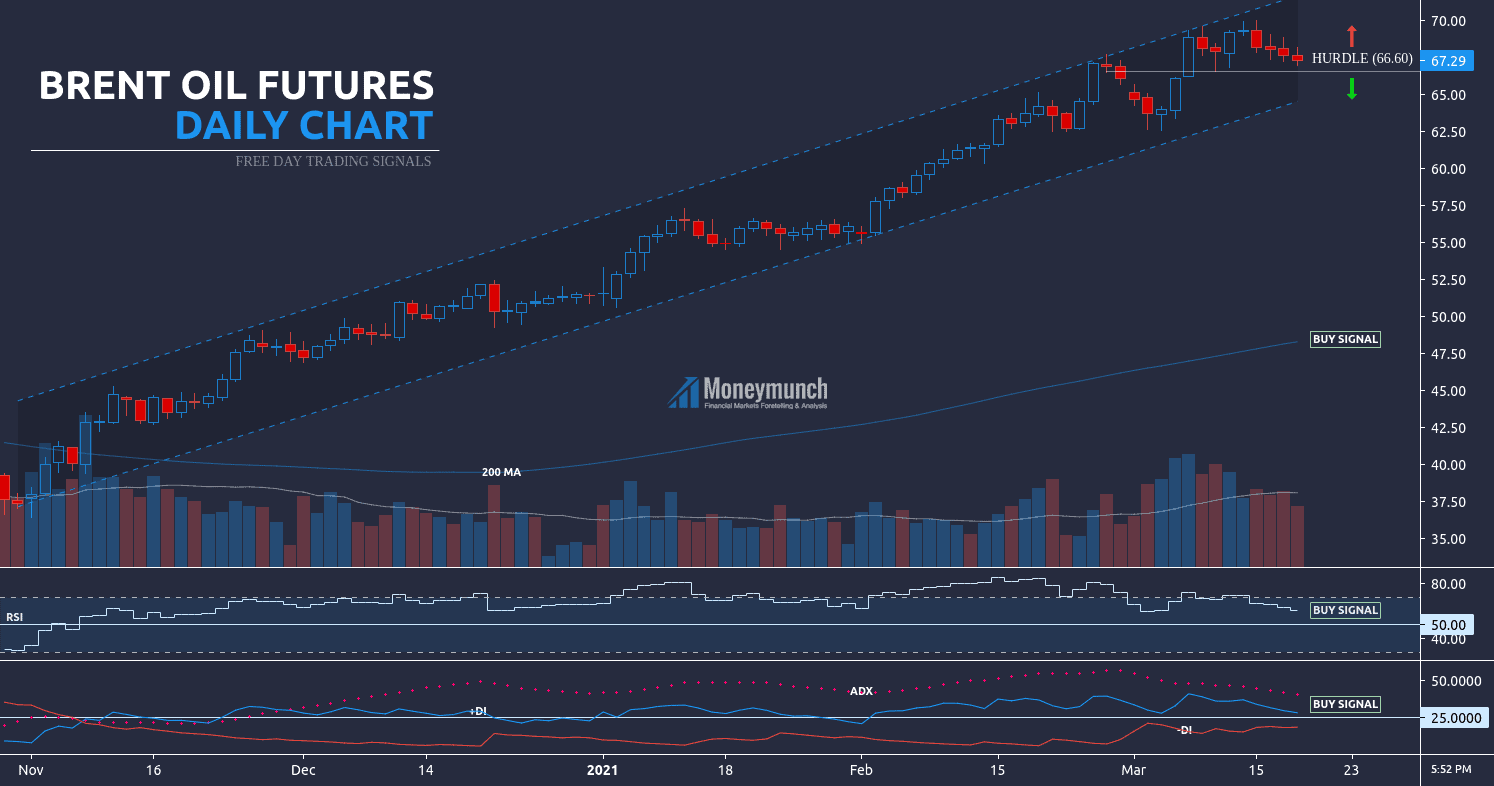
Here, I have used MA, RSI, VOL, & DMI to identify the next move of Brent Oil. According to these indicators, it seems bullish ahead. We may see the following targets soon: $68.8 – $69.8 – $71+
But, if brent oil breaks the hurdle ($66.60) and shows a closing price below it, we will see a heavy downfall. Targets: $64.6 – $62.8 and below
What about MCX Crude oil? It looks downward for a short period. Look at the below chart:
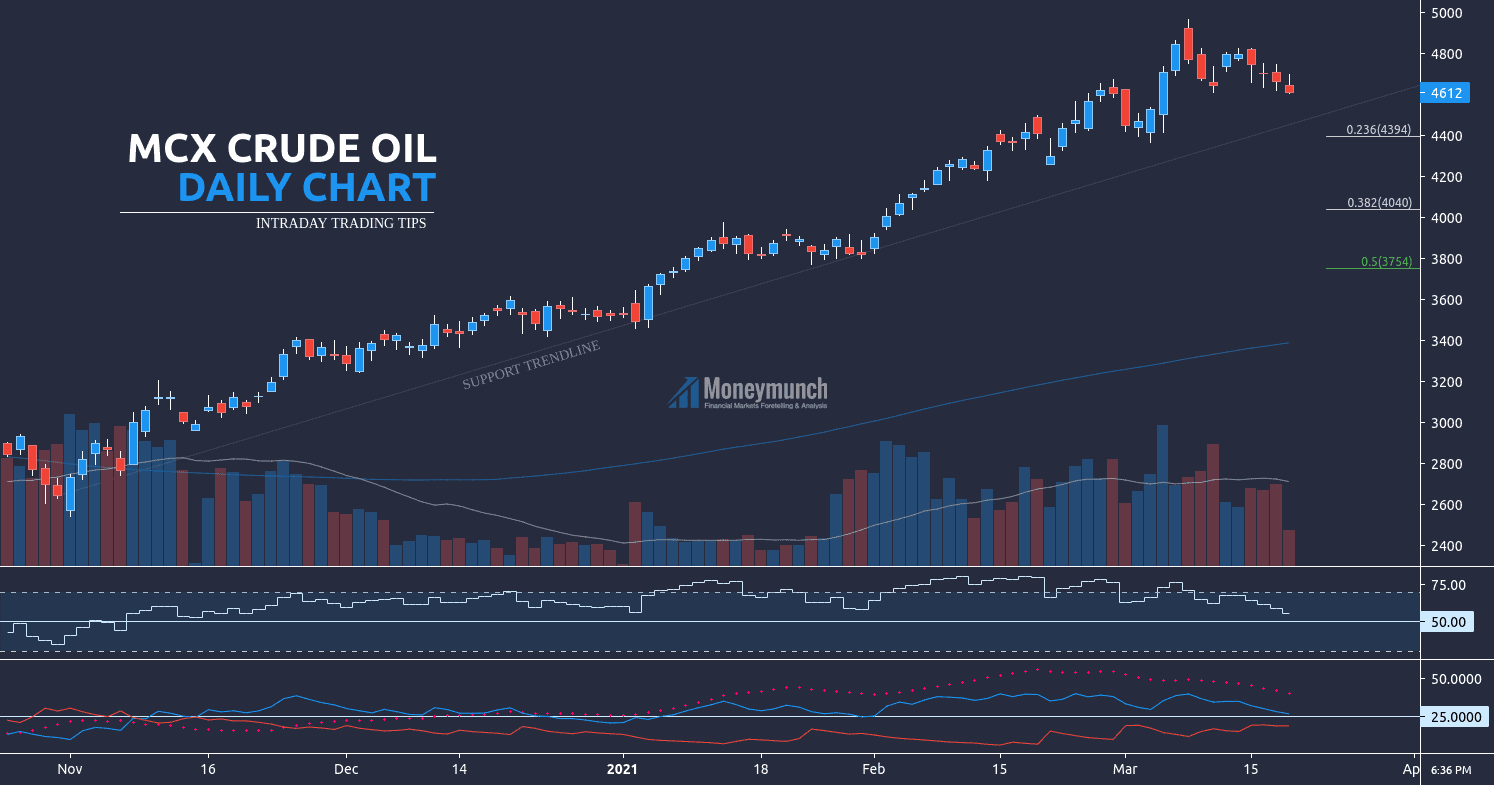
MCX Crude oil can go down for a retracement value of 0.236 in the upcoming days. So, intraday traders can set the following targets to make some money: 4560 – 4500 – 4460 – 4400
But, if brent oil breaks $66.60 upside, then change your position for the following targets: 4800 – 4880+ To become a subscriber, subscribe to our free newsletter services. Our service is free for all.
Continue reading
MCX Gold & Mentha oil Tips & Updates
PART 2: When Will MCX Gold explode?
 On 15 Feb 2021, I have written an article on Gold. First, click below & read again:
When Will MCX Gold explode?
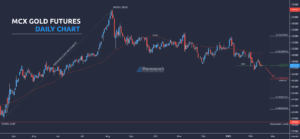
I have written in that article, “If gold remains below 47296 levels, it will come down to 0.618 value of Fib retracement. Targets: 46860 – 46600 – 46000 – 45660 – 45200“.
Gold has touched all targets.
NEW UPDATE:
Keep eyes on the retracement value of 0.618. It will act as a resistance.
Targets: 44260 – 43600 – 43000 – 42260
Alternative scenario: If gold remains above 45200, it may try to hit 0.382 (TP: 46000 – 46800+).
To become a subscriber, subscribe to our free newsletter services. Our service is free for all.
UPDATE: Mentha oil – Profit Booking Time
How many of you bought Mentha oil after reading this report?
MCX Mentha Oil Overall Outlook Is ‘Strongly Bullish’
Mentha oil made a high of 964.9 yesterday, and the first target has come.
Approx. Profit /L = Rs.15,000+
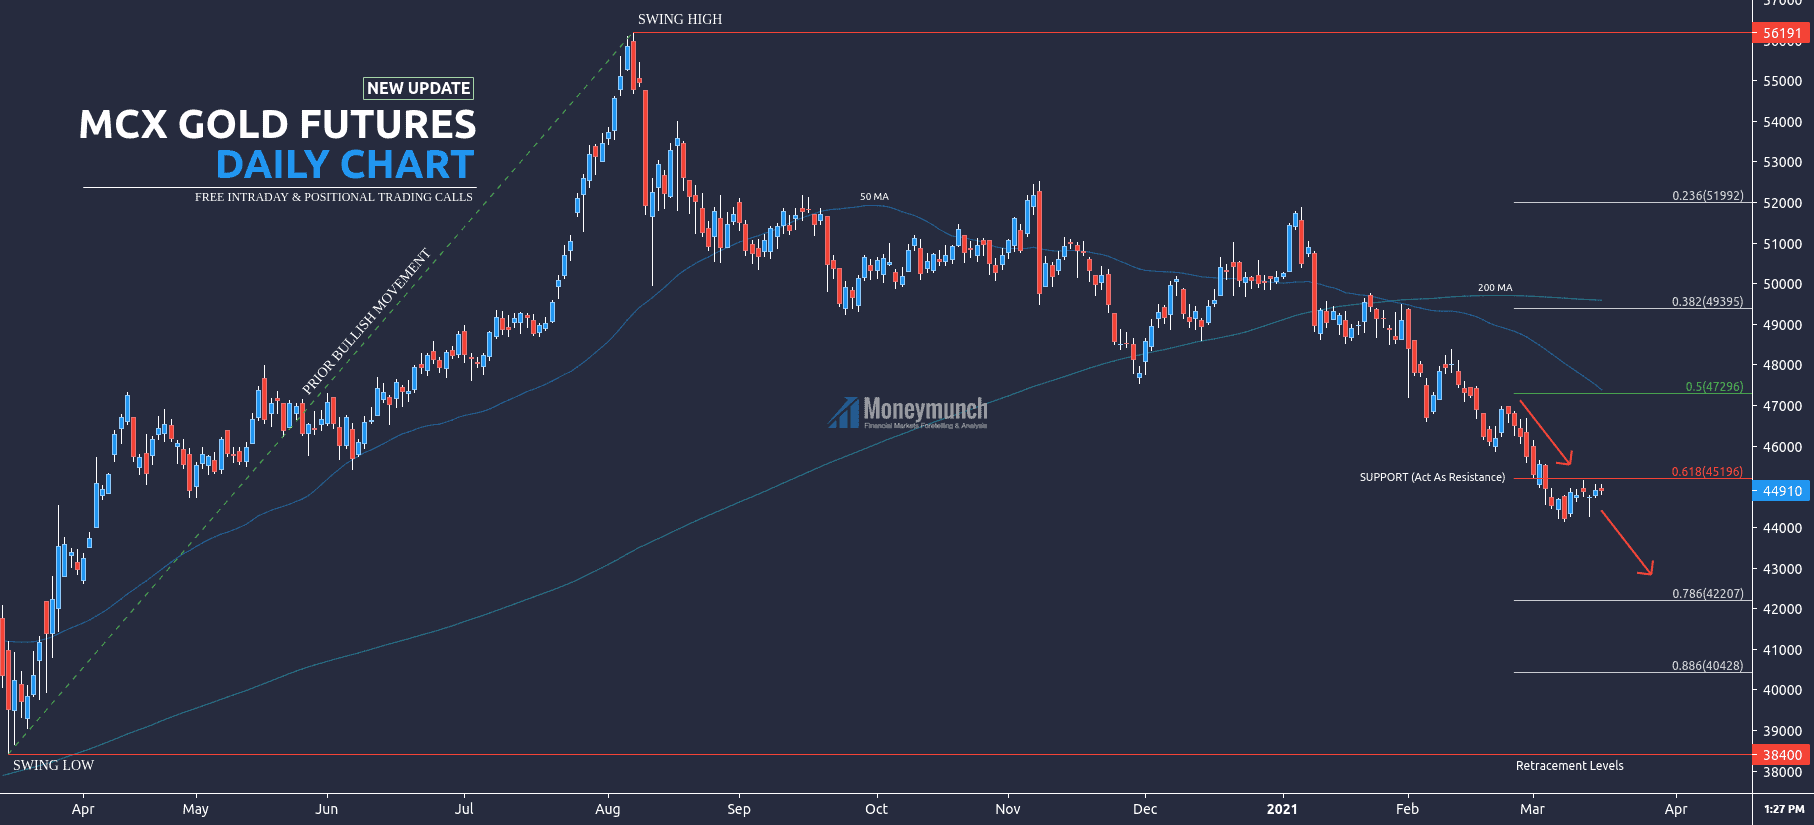
The short-term investors can book profit here. As I mentioned in the above chart, it’s MA crossover time. It may move sideways.
Overall, it’s in an uptrend. Hence, the targets will remain the same.
Continue reading
MCX Gold Guinea’s Downtrend: Is This Just the Beginning?
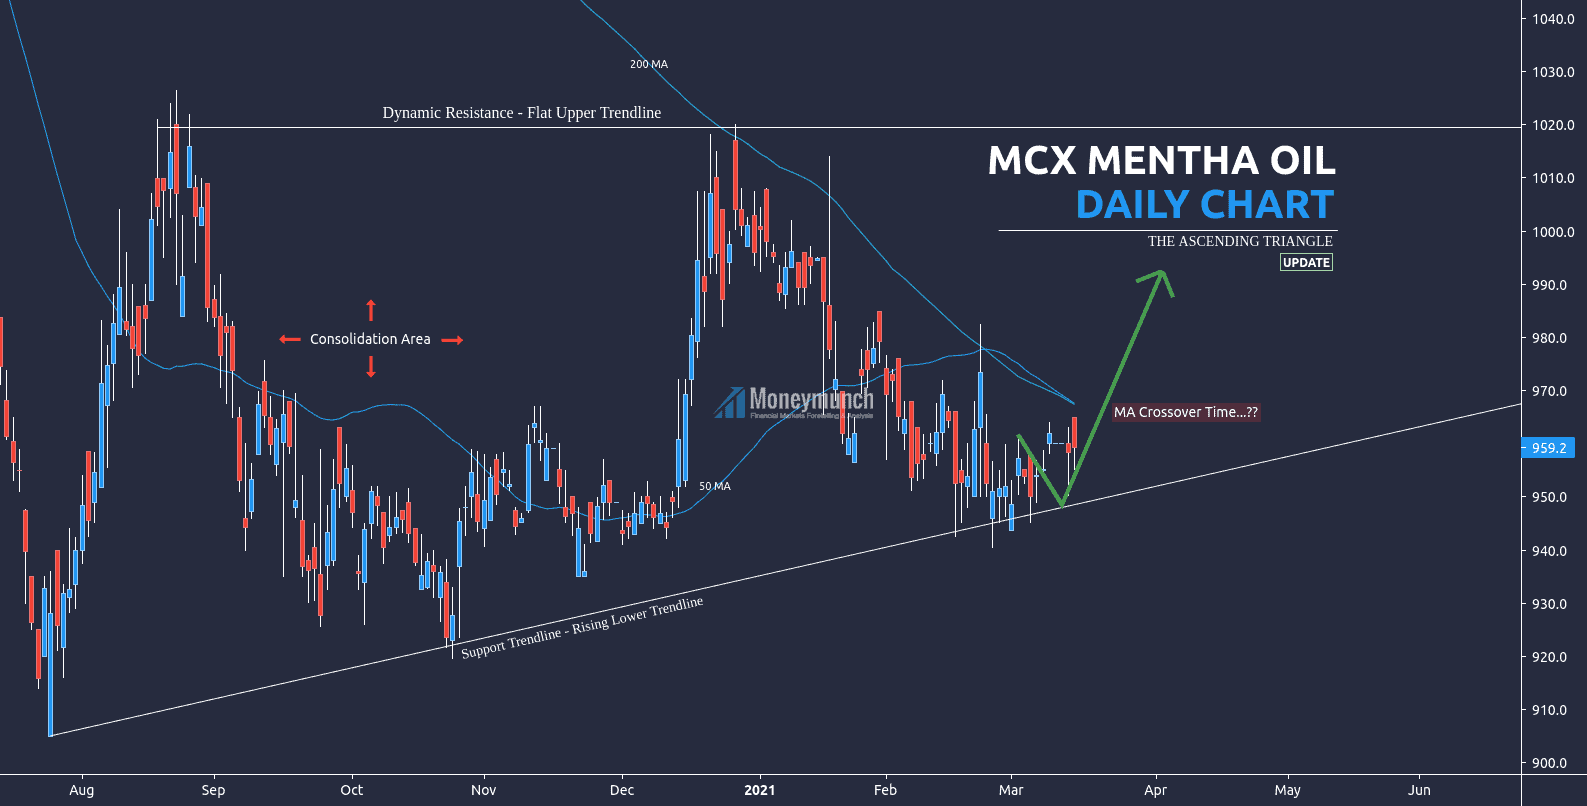
MCX Gold Guinea is following a parallel channel since August 2020. Recently, it has touched the support trendline and started moving forward. Will it keep moving? How much? It will keep running for 37600 – 38000 levels.
But according to MA, Gold Guinea should keep falling. And for the following levels: 36800 – 36400 – 36000
To become a subscriber, subscribe to our free newsletter services. Our service is free for all.
Continue reading
MCX Mentha Oil Overall Outlook Is ‘Strongly Bullish’
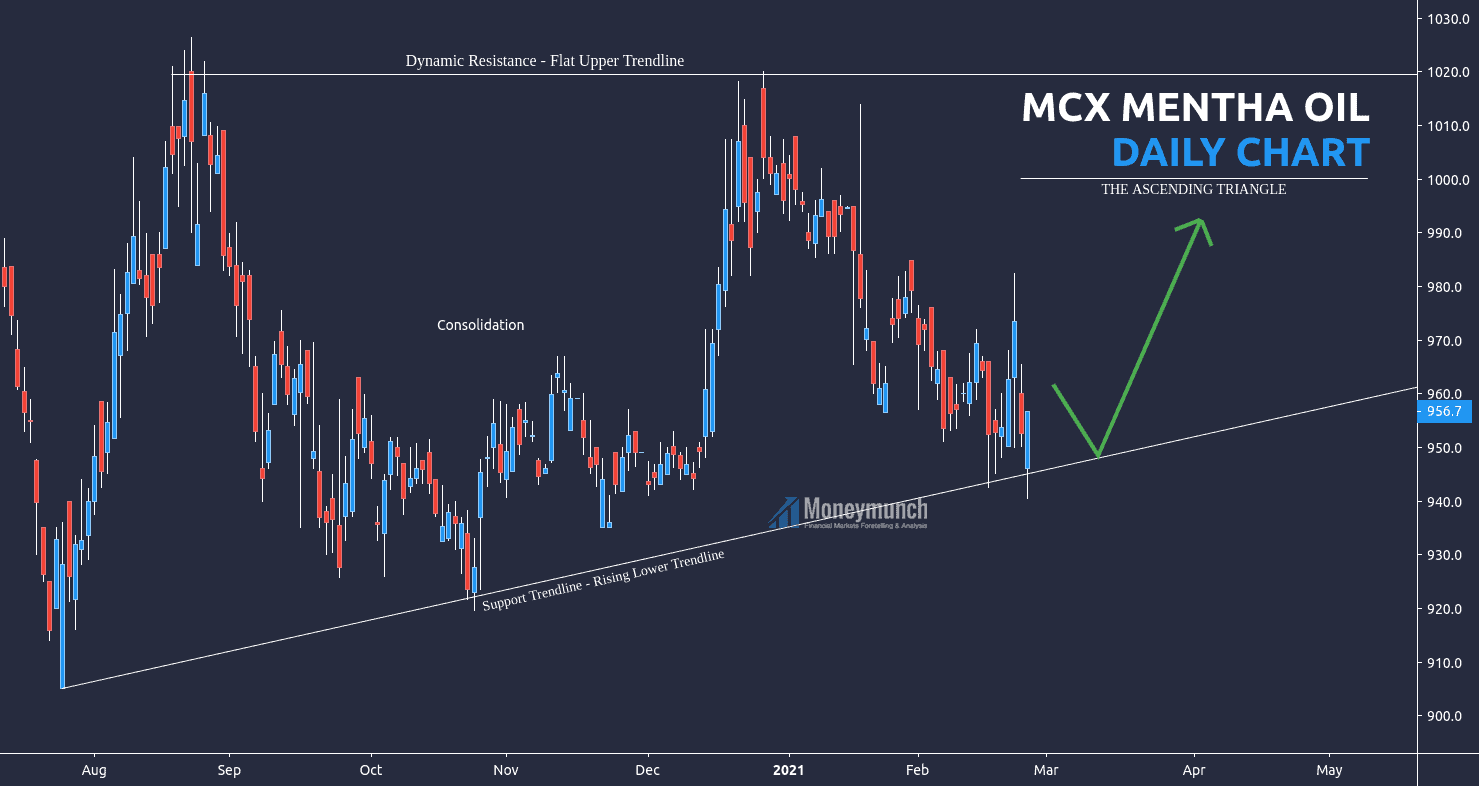
First, wait for a clear ascending triangle form. Right now, MCX Mentha oil at the support trendline (rising lower trendline). It will try to hit 964 – 986 – 1000 – 1020 levels from here. Intraday traders can go with the current trend.
But don’t buy below the support trendline. To become a subscriber, subscribe to our free newsletter services. Our service is free for all.
Continue reading