LONG-TERM INVESTORS:
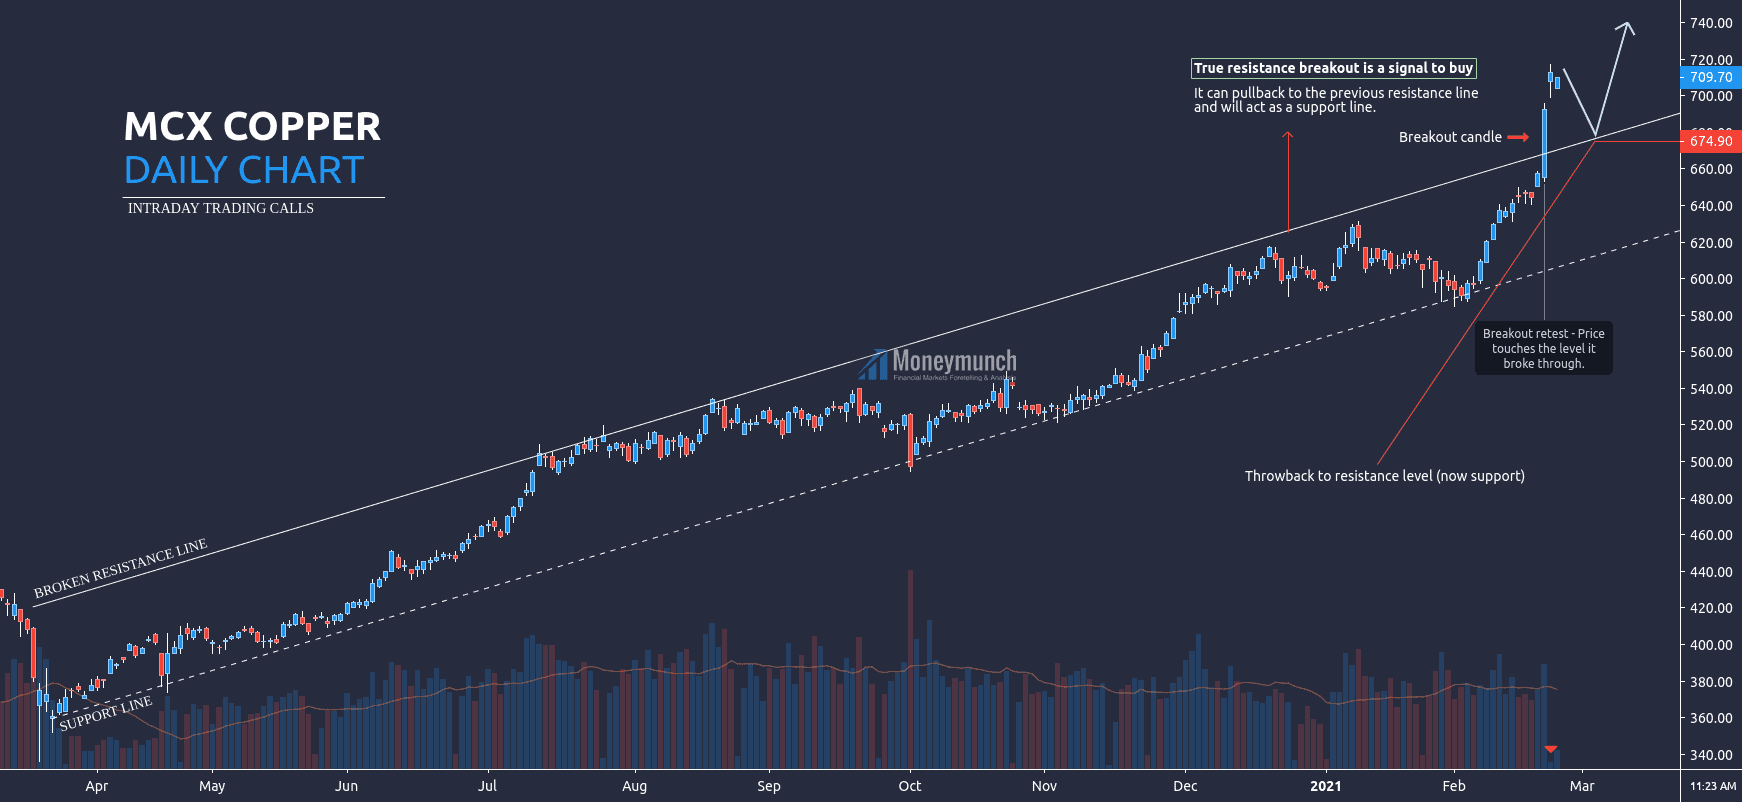
Copper has broken March 2020 resistance trend line, and true resistance breakout is a clear signal to buy. Target prices for long-term traders: 760 – 800+
INTRADAY TRADERS:
But at present, MCX copper can pull back to the previous resistance line to continue an uptrend. So, intraday traders can sell for the following targets: 690 – 680 – 676
To become a subscriber, subscribe to our free newsletter services. Our service is free for all.
Continue reading