Mr.Dev (s)

Mr.Dev(s) is a team of non-biased certified technical and research analysts with extensive experience in the financial markets dating back to 1997. They accurately forecast market movements and position their clients accordingly. They are popular online contributors on many channels and platforms, known for their non-biased advice and commitment to helping investors make informed decisions. The team is also the founder of forex account management services on Moneymunch.com, demonstrating their knowledge and experience in the financial world. Investors can rely on Mr.Dev(s) for research reports and opinions, as well as trading guidance.

Join Today (Free): Commodity Tips | Forex Signals

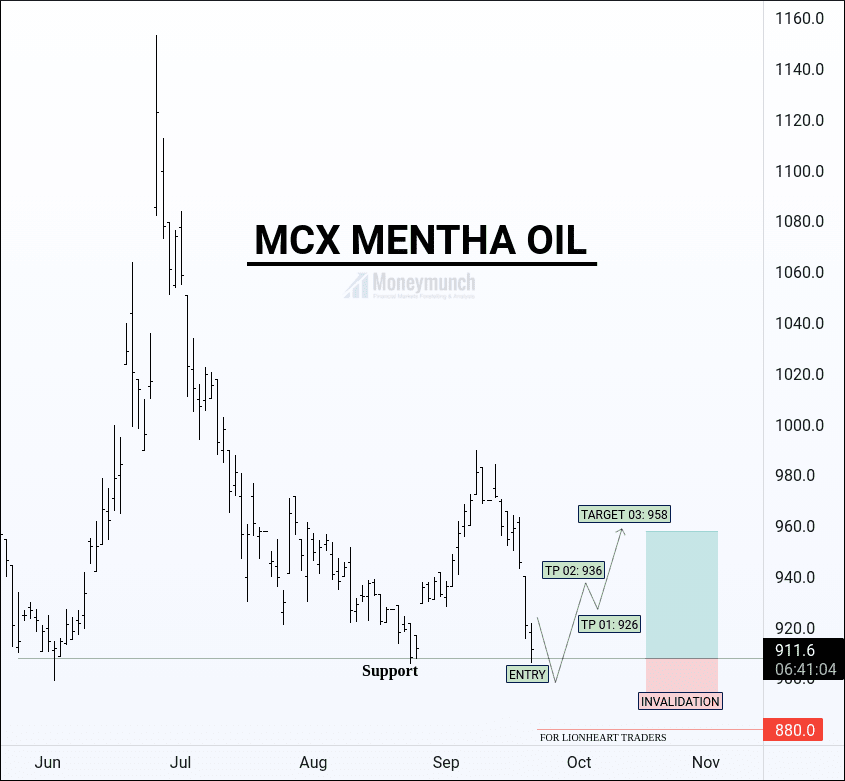
Will Mentha Oil Touch 960 Level Again?

free commodity mcx menthaoil tips chart

MCX Mentha oil can bounce here. It can retest the 960. The intraday & short-term investors should enter around the support trendline for the targets of 926 – 936 – 958.

To become a subscriber, subscribe to our free newsletter services. Our service is free for all.

Continue reading

Gold: These Two Levels Can Change The XAUUSD Trend

free commodity gold (xauusd) tips & daily chart

Advice For Day Traders:

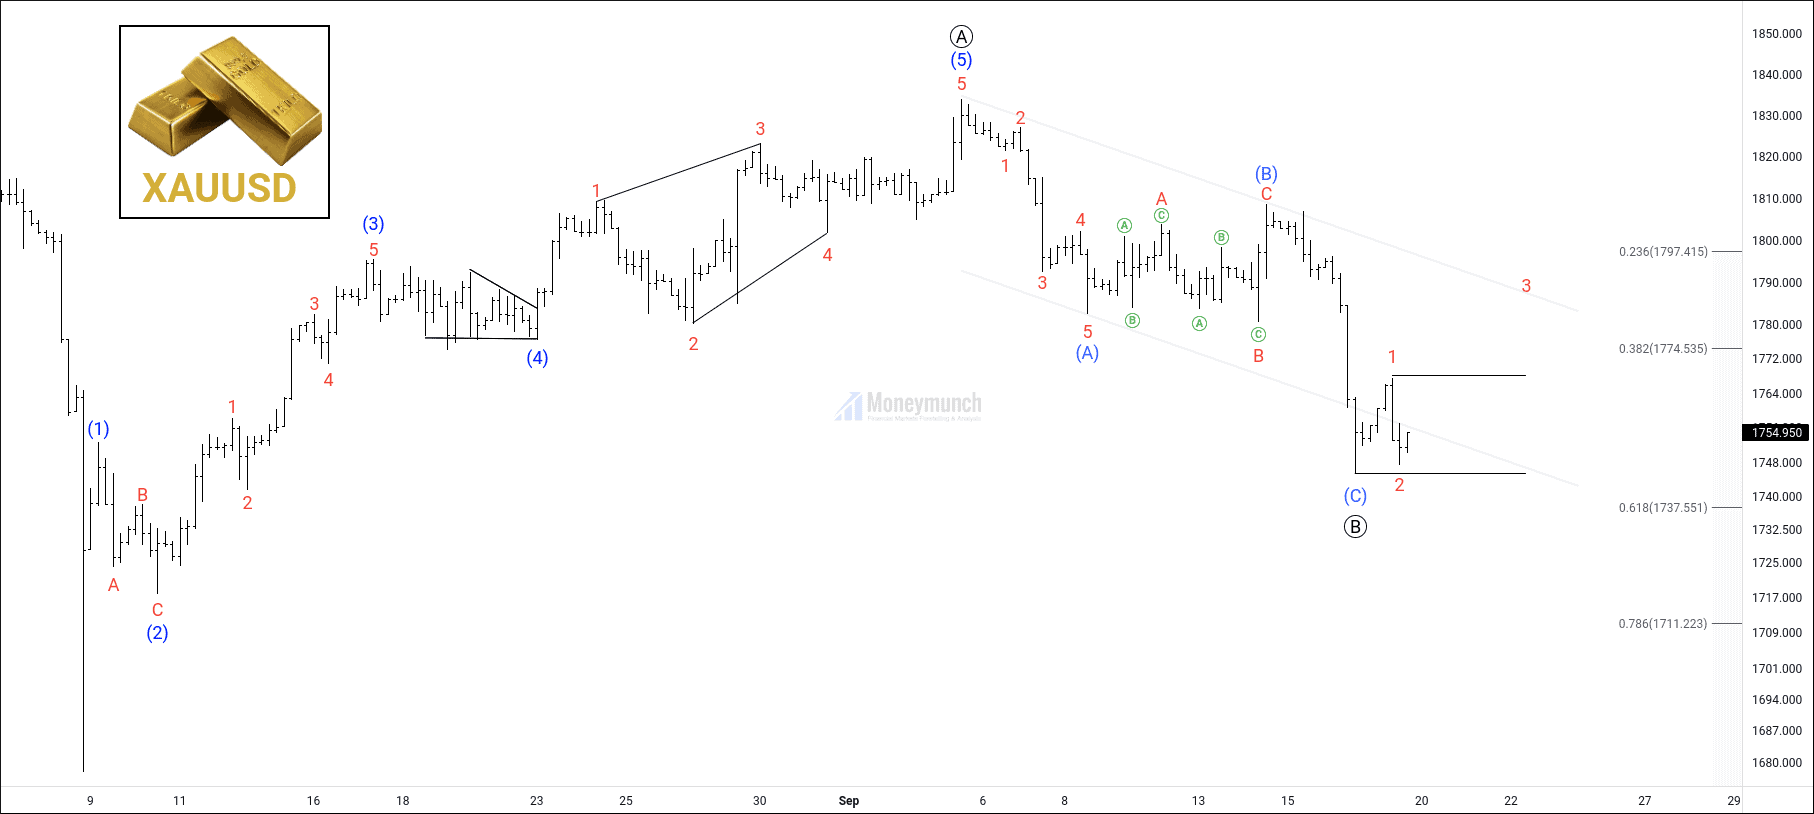
XAUUSD is not tradable between the range of 1766 to 1745. They are trend changer levels.

Gold’s Simplified Trading Strategy:

According to Elliott Wave theory, it was in a corrective wave. It has completed the ABC, and now gold can start marching for a new impulse phase. Therefore, we can expect the gold’s target price 1782 – 1790+. In simple language, you should wait for the breakout of 1766 or 1745. Because of that’s a crucial level for XAUUSD traders. If gold will break down the 1745 level, then the downtrend will begin. And that downtrend can drag it down up to 1730 – 1706 – 1686. Please note, don’t forget to watch significant releases or events that may affect the movement of gold, silver, and crude oil:Continue reading

MCX Crude oil calls: Profit Booking Time

free commodity crudeoil chart tips updates

Update: Will Crude Oil Hit 5400 Next Weekend?
How many of you bought crude oil nearby 5130 after reading my article?

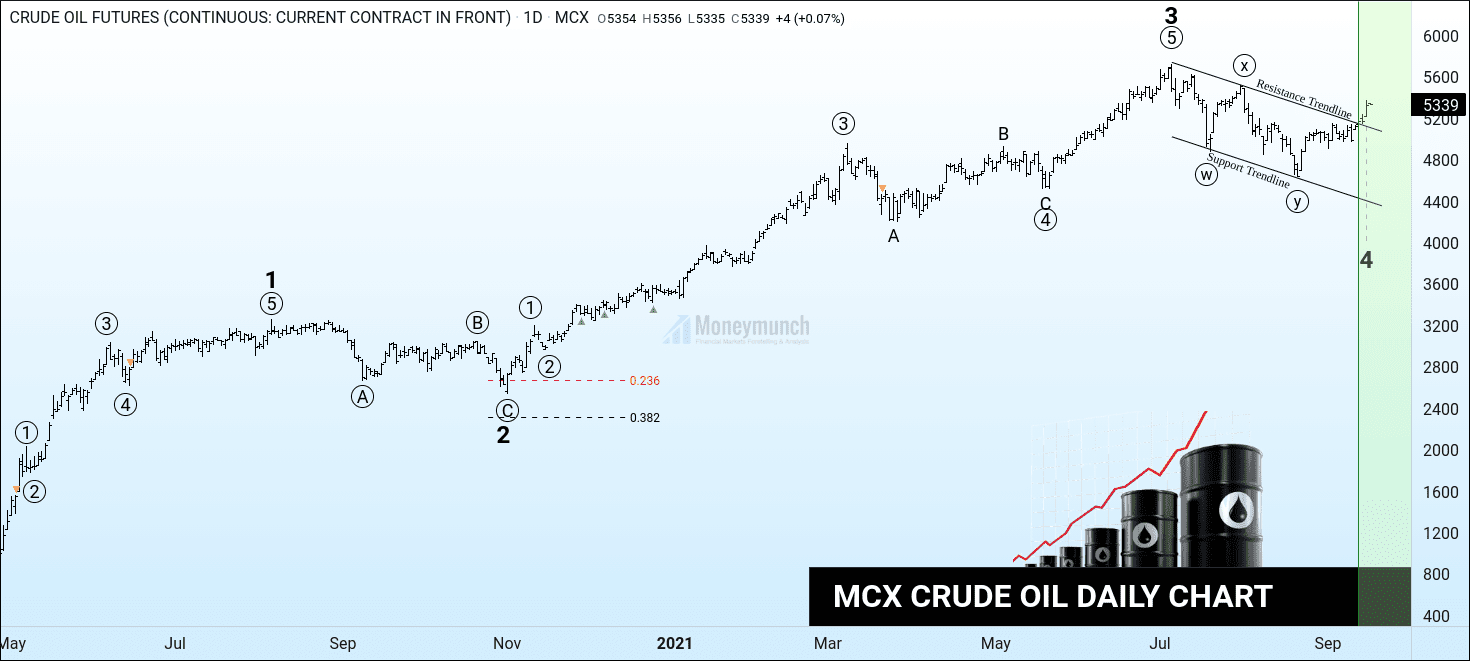
I had written in bold words, “…so, what about short-term investors and intraday traders? If you look into 4 hours chart, it seems bullish from here. Crude oil is trying to break the resistance trendline. Whenever that the resistance trendline break, then we may see the prices at 5300 – 5400+“.

It has touched the first target.
Safe/intraday traders can book full profit here.
To become a subscriber, subscribe to our free newsletter services. Our service is free for all.

Continue reading

Will Crude Oil Hit 5400 Next Weekend?

free commodity crudeoil daily chart & tips

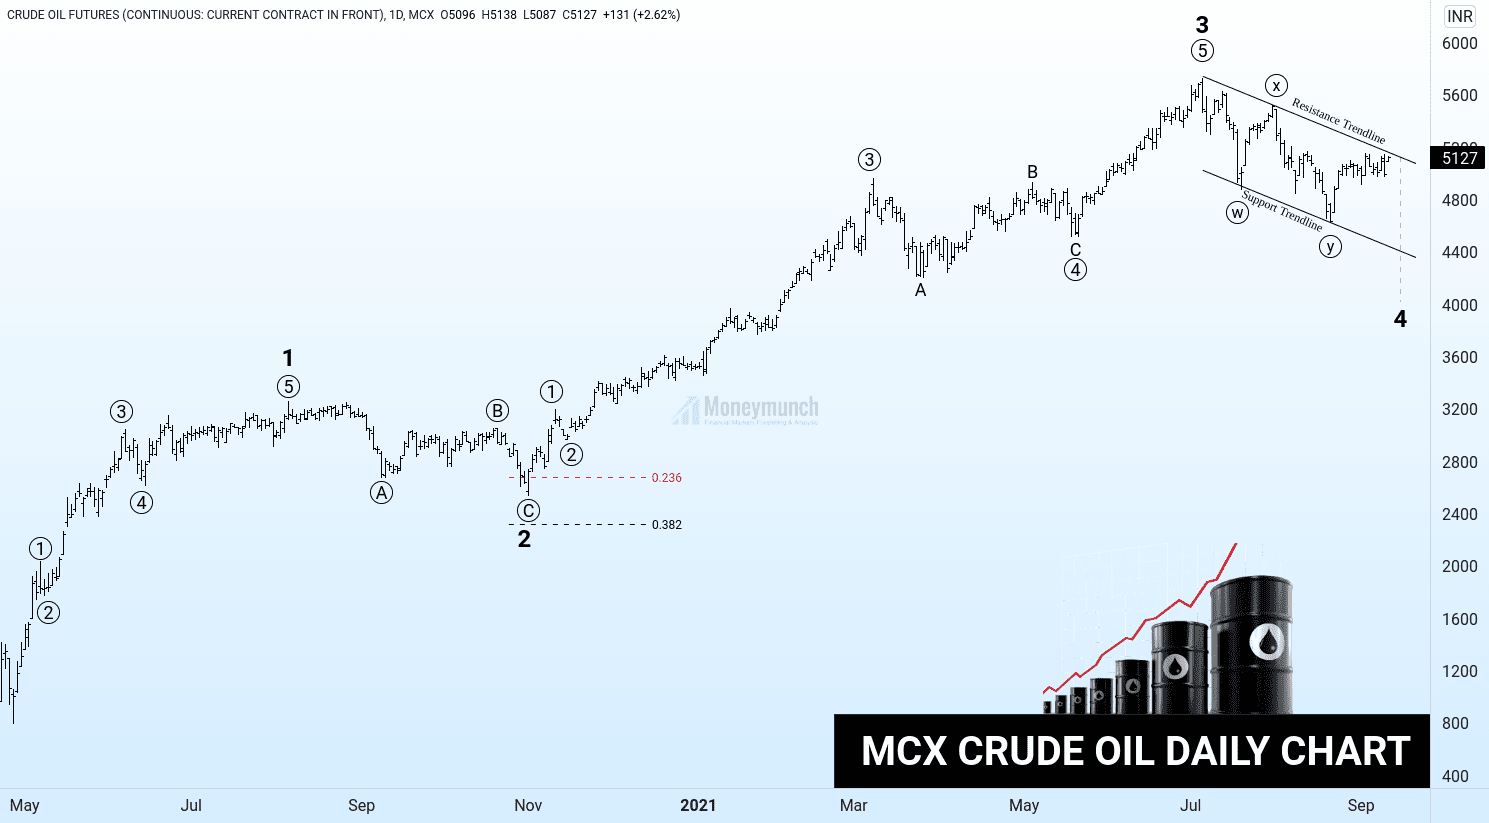
Crude oil has started moving forward since May. And it will not stop here. It’s just a WXY correction.

According to Elliott’s wave theory, it has completed the sub-wave under the 4th wave. It’s consolidation time. Crude oil prices may fluctuate between the range of 4000 – 5400. Hence, long-term investors can keep buying crude oil.

So, what about short-term investors and intraday traders? If you look into 4 hours chart, it seems bullish from here. Crude oil is trying to break the resistance trendline. Whenever that the resistance trendline break, then we may see the prices at 5300 – 5400+.

Kindly note, if crude oil remains below to resistance trendline, then do not buy.

What happens if it does not break the resistance trendline? To become a subscriber, subscribe to our free newsletter services. Our service is free for all.

Continue reading

Will Bitcoin reach $1,00,000 Before 2022?

BTCUSD Bitcoin Cryptocurrency Signals

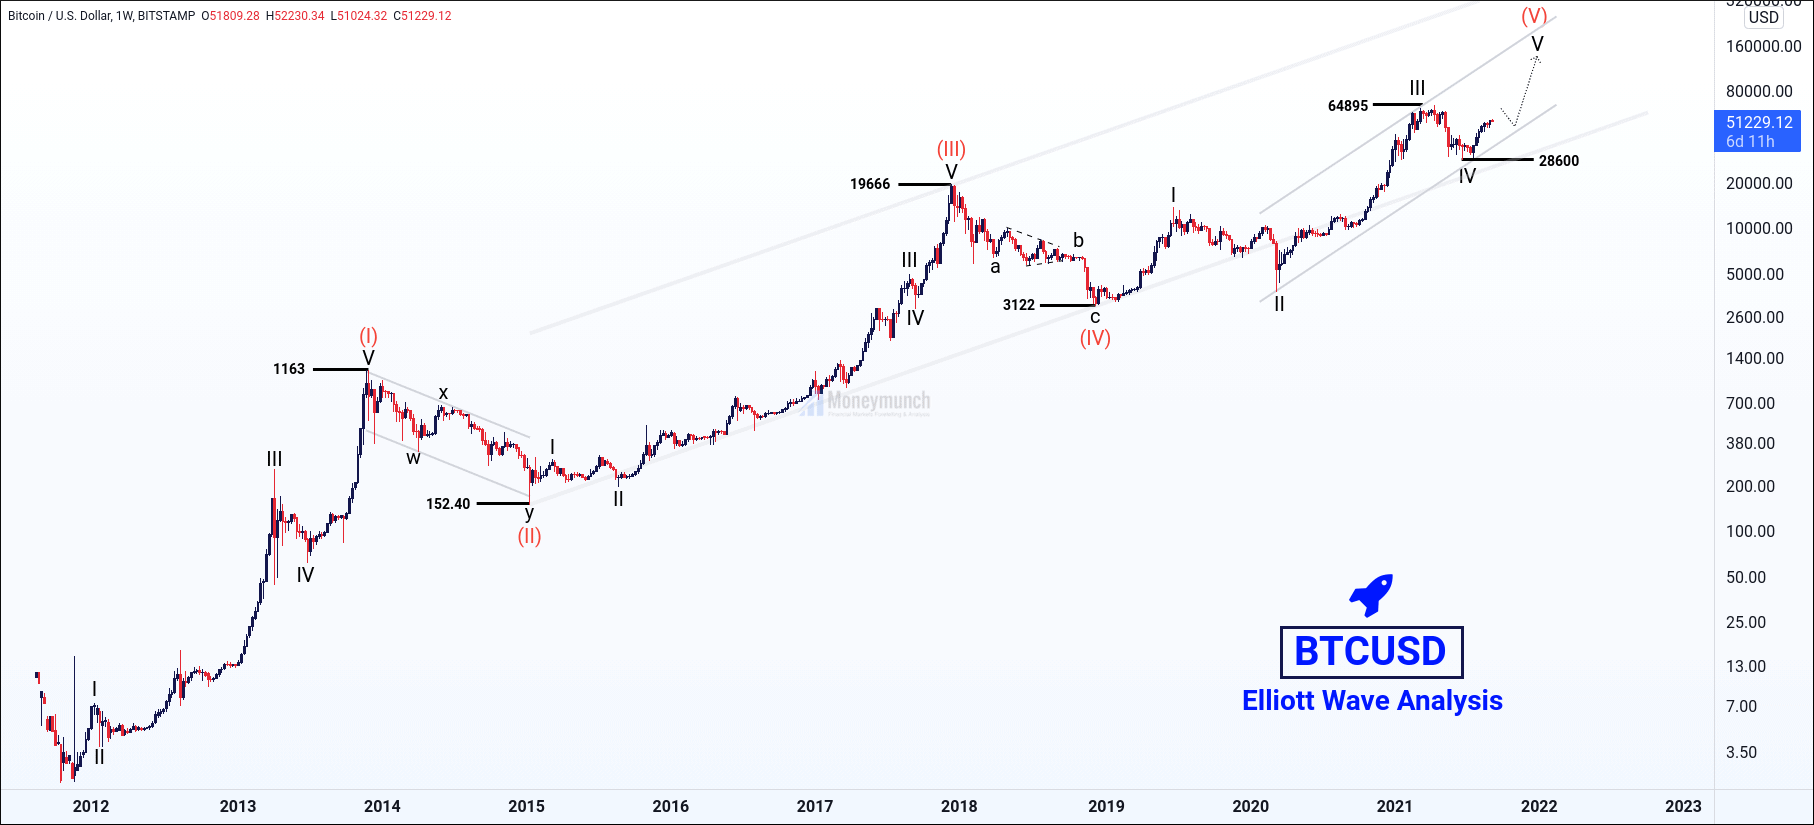
Bitcoin prices were moving upward at the beginning of 2021. But, its investors have seen heavy downfall into May to June. Afterward, it has hiked from 28600 to above 51356. According to Elliott’s wave theory, it’s running under the 4th wave. We may see a sideways trend here. Bitcoin is preparing for a solid uptrend ahead. It’s a right to jump on Bitcoin for the long-term investment. And the correction can be between the range of 28600 to 50000 because it will start marching for $1,00,000 soon.Continue reading

EWP: Will GBPUSD touch 1.400 before the next weekend?

free forex gbpusd 4h chart & signals

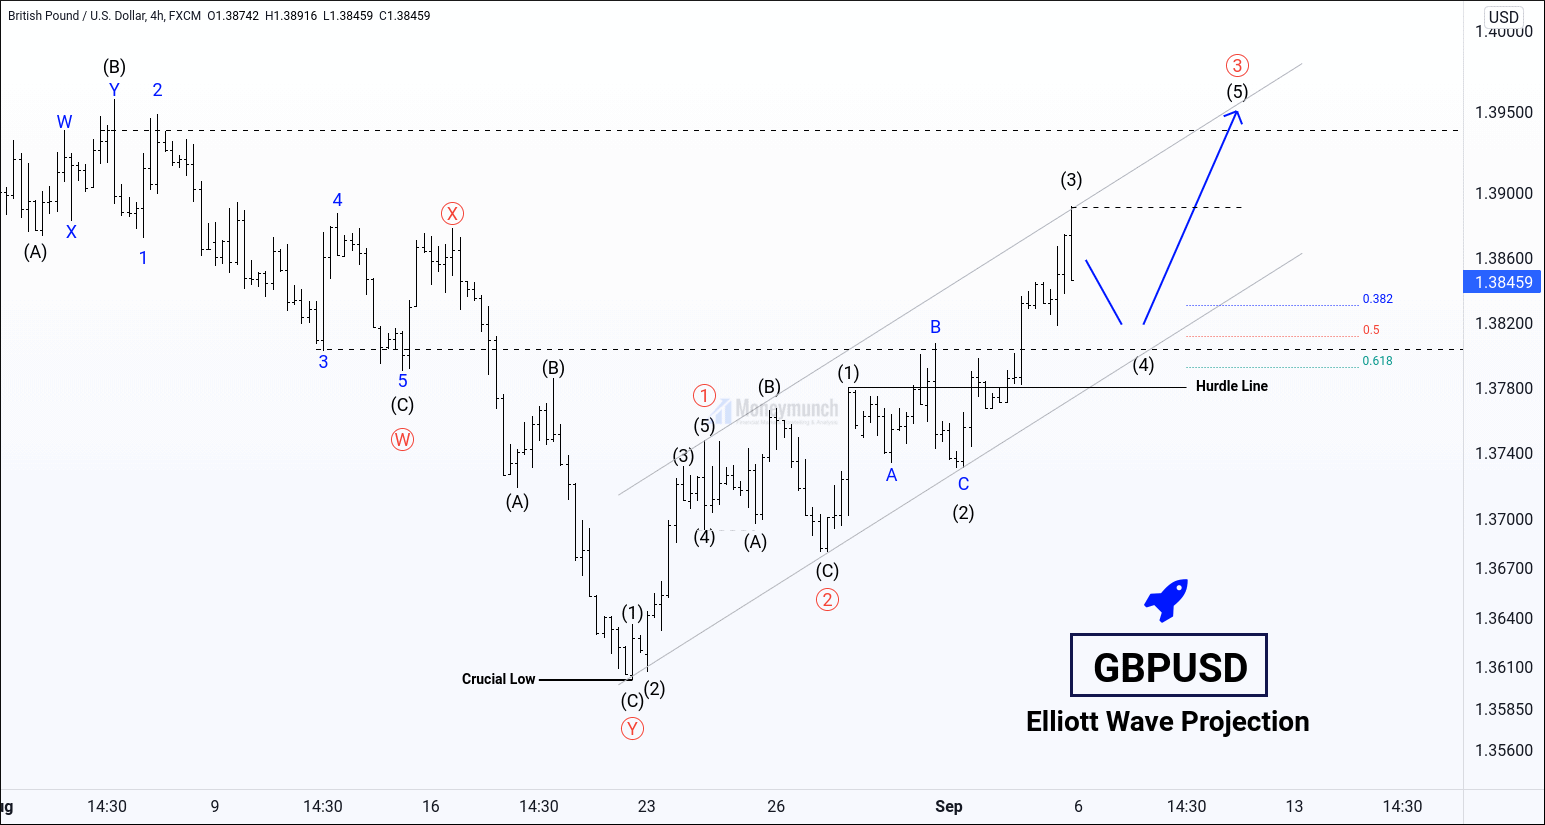
Price has made significant Low at 20th August 2021. Extreme low has given us beautiful Impulsive structures. Wave ((1)) Wave Nature: Motive wave Type of motive wave: Impulse (Five waves) Wave ((2)) Wave Nature: Corrective waves Type of corrective pattern: Irregular or Expanded flat. Retracement of wave ((2)): 50% of wave ((1)). Wave ((3)) Wave Nature: Impulse (3rd wave can only be an Impulse with 5 waves) Extension of wave ((3)) : At this motion, price is riding on sub-wave (3) of wave ((3)). Wave has an extension of ((3)) 161.8%, but the party is not over yet. We are to get waves (4) and (5) of wave ((3)). One can expect 2.618% of wave ((3)) and even more! Sub-waves of wave ((3)) : Wave (1) is an impulse. Wave (2) is an irregular flat. Wave (3) is an impulse. Extension: 161.8% of wave 1 The price extension of wave (3) is 161.8%. If the price breaks the 1.39154 level without any correction, we will have a powerful extension. Wave (4): According to rules of alternation, if the second wave seems flat & time-consuming, then wave four can be sharp and quick. We may get a running triangle or a zigzag correction. Common Retracement: 38.2% of 3rd wave at 1.38305 50% of 3rd wave at 1.38101 61.8% of 3rd wave at 1.37924 50% retracement for wave 4 is acceptable for two reasons: 1. An Important support level is the 1.38107 – 50% retracement level of Wave 3. 2. Wave 4 is more often complete nearby the sub-wave (4) of wave ((3)). If the price breaks the hurdle line, Continue reading