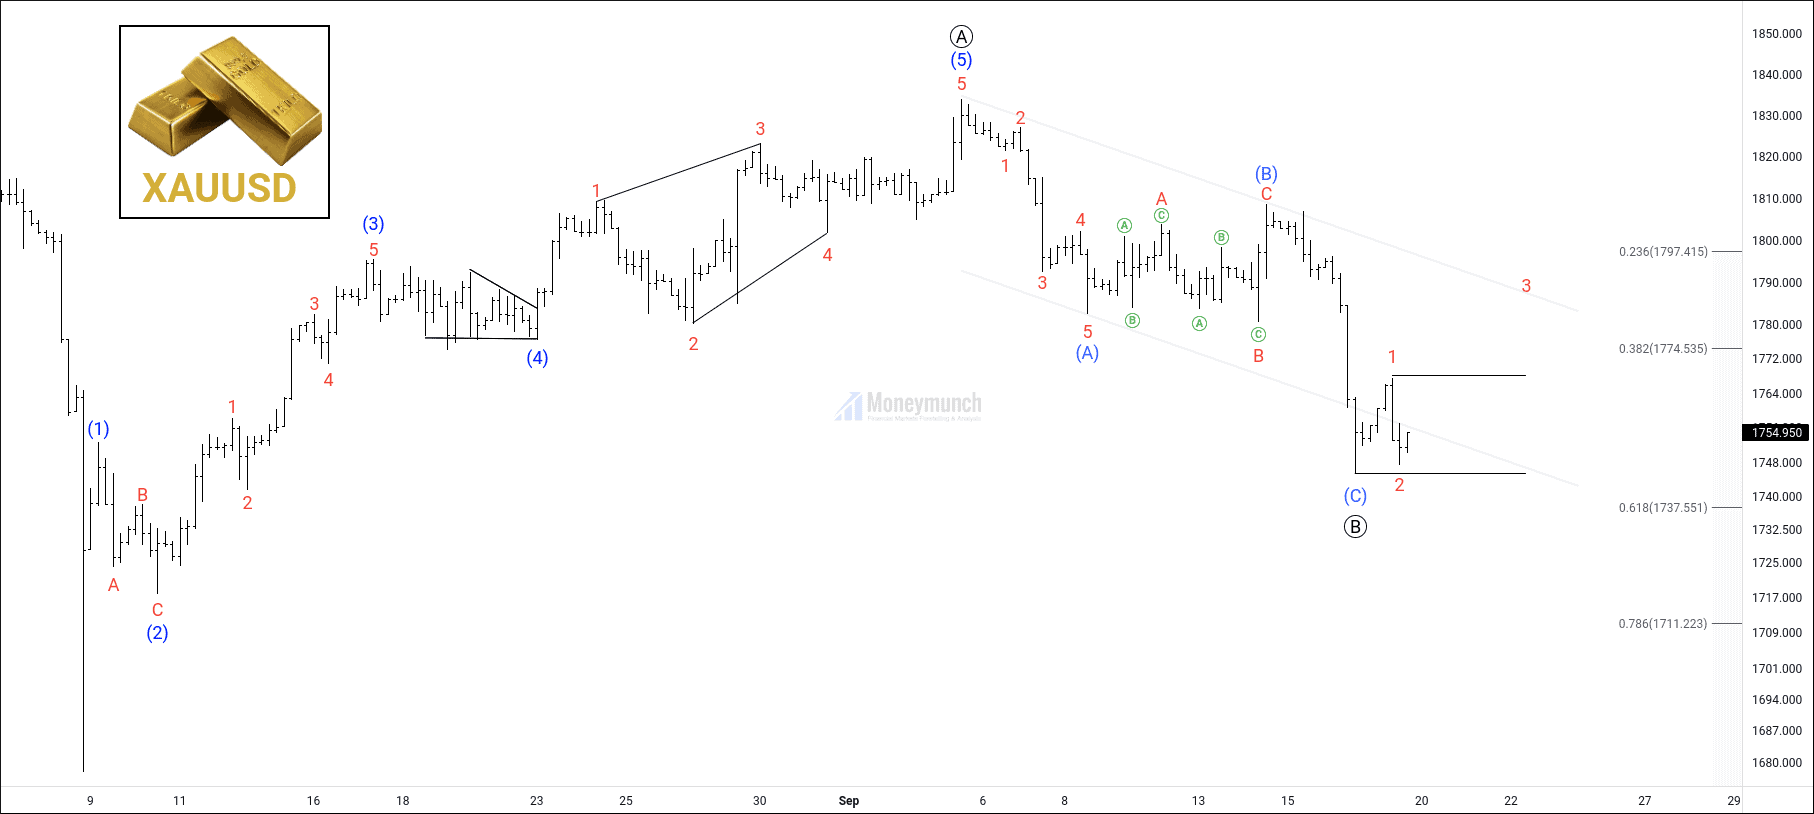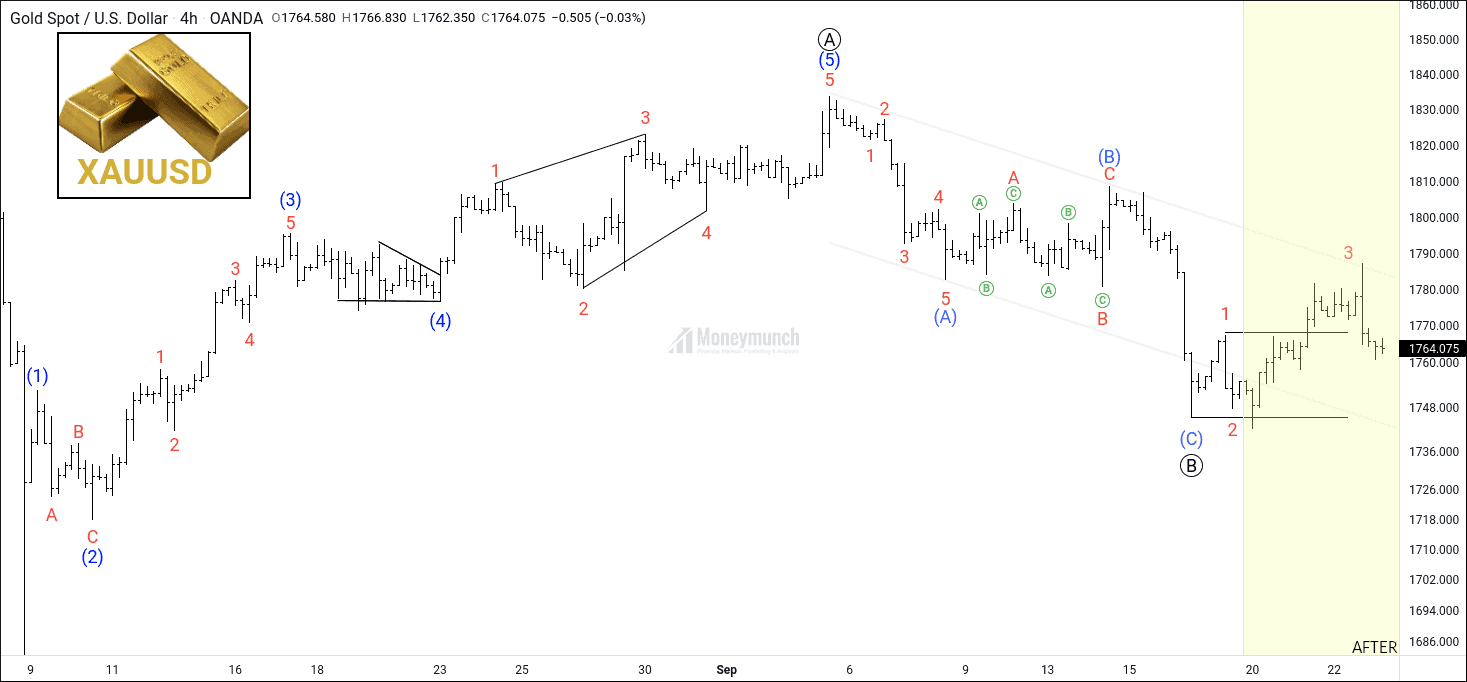
Update 2: Gold Price Slowly Going Upside
Did you read the previous report of MCX Gold? If not, click the below link to read it.
Unlocking The Next Targets of MCX Gold, Crude oil, & Aluminium
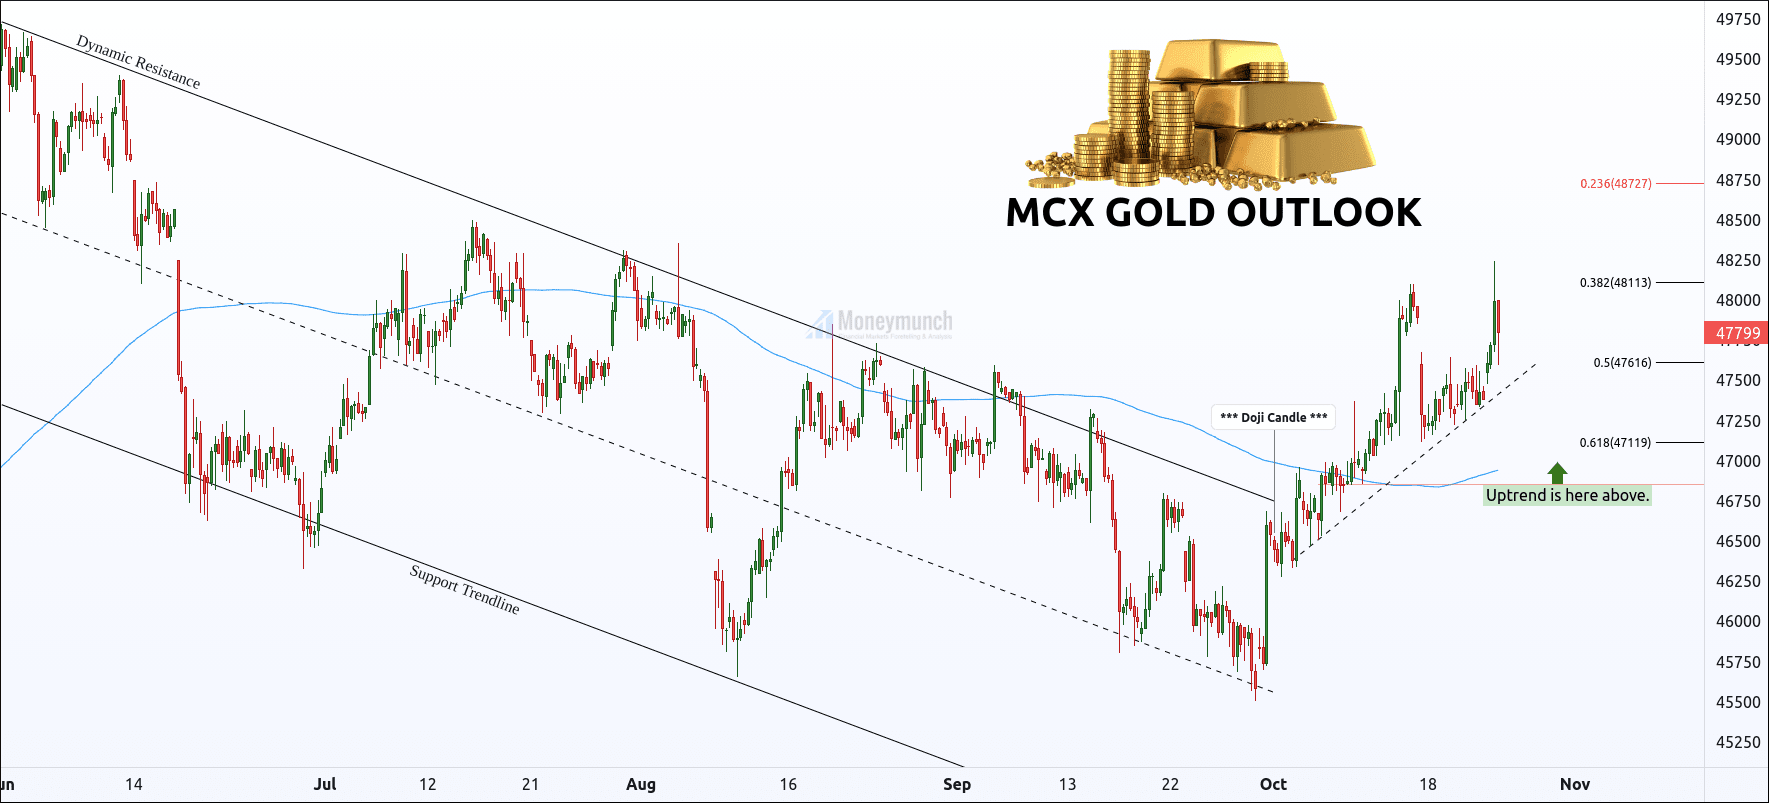
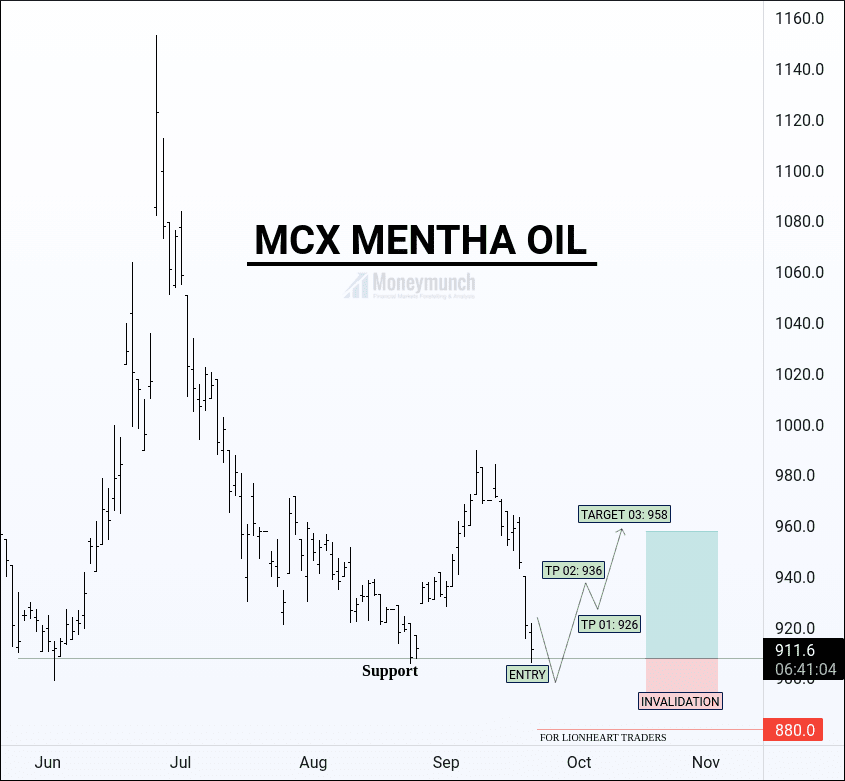
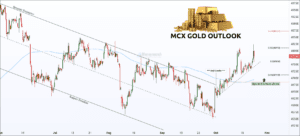
I had written, “Key levels: 48113 – 47616
MCX gold has been moving under the range of 48113 – 47616. It’s a very crucial point. We may see a continued uptrend ahead if it breaks and close above 0.382 retracement level. That can be up to 48260 – 48490 – 48600 – 48700“.
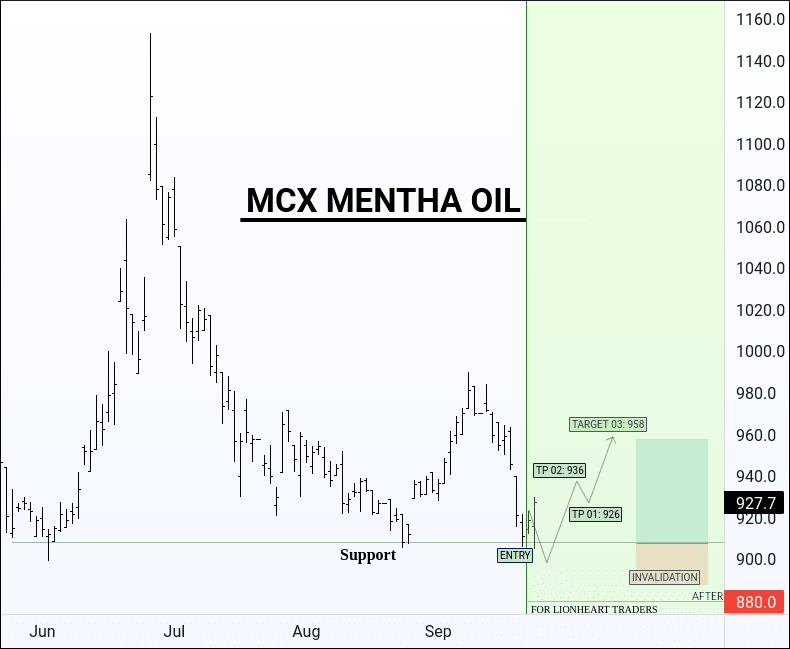
Gold has taken a reversal after hitting the first target. Do you think it will go upside from here? To become a subscriber, subscribe to our free newsletter services. Our service is free for all.
 Unlock This Article
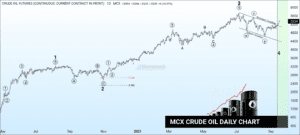
Update: Beware, Crude Oil Bulls – That’s the Beginning of the End

First, click the below link and read the full crude oil report.
Unlocking The Next Targets of MCX Gold, Crude oil, & Aluminium
Here I had written in clear words, “Crude oil may keep running upward for the levels of 6360 – 6500+. To maintain an uptrend, it has to crossover the hurdle level of 6290 by closing above”.
It has touched the first target and bounced off to entry-level again. MCX crude oil will keep moving forward until kick at the last TP.
To become a subscriber, subscribe to our free newsletter services. Our service is free for all.