Timeframe: 4-h
NSE Wipro has been forming a downtrend for more than 12 weeks. Prices have retraced 61.8% of the upward move from the extreme low of 159.4. After making a high of 739, prices collapsed by more than 50%.
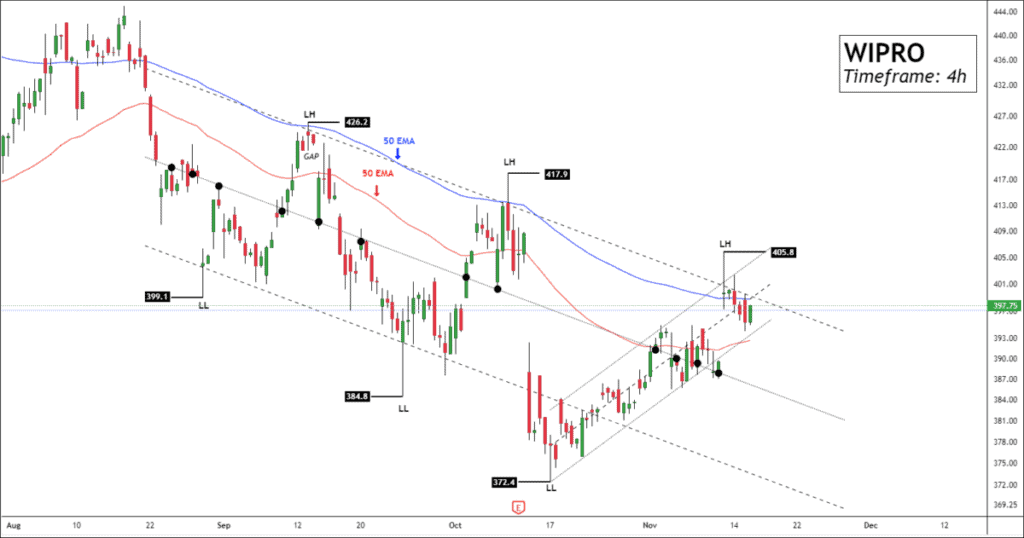
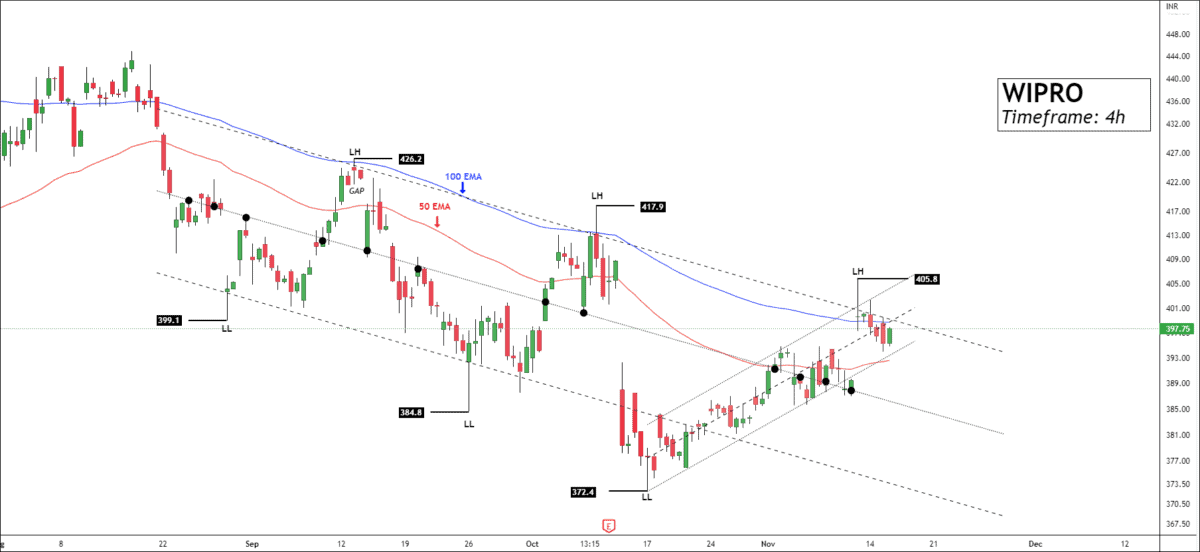
I have drawn a corrective descending channel on the 4-hour timeframe chart. Every time the price touches the lower band, it reverses with the supply pressure. The upper band & lower band both face supply and demand pressure outside the equilibrium area.
WIPRO is in a classic downtrend as the price is forming lower lows and lower highs. Currently, Prices are on the upper band of the parallel channel and failed to sustain above the previous lower high. Note, prices also got a rejection from 200EMA, which signals bears are leading the movement.
WIPRO can face strong resistance nearby 410. If the price sustains above 410, traders can buy for the following targets: 416 – 426 – 441+.
I also draw the corrective channel within the correction channel break down will lead to a downward move up to control line or even more bearish with the following targets: 382 – 371 – 362.
Bearish outlook should not be traded if you cannot get a good risk/reward ratio, since the price is already in the oversold zone.
I will update further information for subscribers soon. To become a subscriber, subscribe to our free newsletter services. Our service is free for all.
Get free important share market ideas on stocks & nifty tips chart setups, analysis for the upcoming session, and more by joining the below link: Stock Tips
Have you any questions/feedback about this article? Please leave your queries in the comment box for answers.
good chart
A fantastic read! Very insightful for me being an economics student, currently undertaking a derivatives and markets topic.
Appreciate the work and explanation you put into this. You’re an asset to the trading world.
Your charts work most of the time. Please don’t stop these analysis.