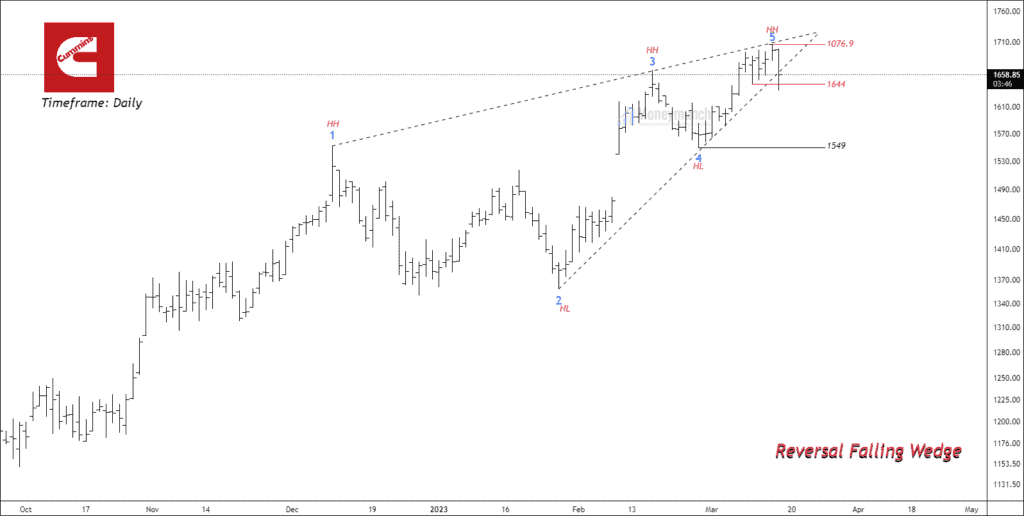
NSE Cummins’ Rising Wedge Breakdown Alert
Timeframe: Daily
As of March 16th, 2023, NSE Cummins has formed a falling wedge pattern over a period of 23 weeks. A rising wedge pattern is a chart pattern characterized by a contracting price range between two converging trend lines. In this case, the price range has been contracting after making higher highs and higher lows successively.
The stock price has declined near the upper trend line and is currently trading outside the lower band of the parallel channel. Traders may consider a bearish position if the price sustains below the key support level of 1644 with potential targets at 1604 – 1573 – 1549+.
Once the key support level of 1549 is broken, the price is anticipated to approach the fourth point of the rising wedge pattern. A further bearish sentiment may be observed after the breakdown of point 4. Traders must confirm the movement on a closing basis.
 Unlock This Article
Get free important share market ideas on stocks & nifty tips chart setups, analysis for the upcoming session, and more by joining the below link: Stock Tips
Have you any questions/feedback about this article? Please leave your queries in the comment box for answers.
Great analysis! Your insights into the market trends are impressive.
Well-researched and well-written. Your analysis is a valuable resource for traders and investors.
Your attention to detail in your market analysis is commendable.
The analysis is presented in a clear and concise manner. Thank you for making it easy to understand.
Great resource for traders and investors looking to make informed decisions in the market.
Thank you for your excellent premium subscription service. The real-time patterns and strategies, along with detailed and accurate analysis, have been immensely helpful for retail investors like me. The PRO+ VIP subscription is truly worth it.